Trading Tools

  • Hans Rosling – The Health and Wealth of Nations

    The Joy of Stats is spreading.

    You can watch a history of the modern world, in less than five minutes.

    I'm surprised by how many people have sent links to this YouTube preview of The Joy of Stats


    Somehow, with nothing more than animated bubble charts, Hans Rosling has become quite famous.

    This four-minute clip shows Rosling presenting world development in the context of income versus lifespan. Rosling uses Gapminder, the software he and others had developed, to show multiply varying statistics as animations.

    The material is more or less the same as his TedTalks; but this time around, the motion chart isn't projected on a screen. The data is CGI'd into the air where Rosling can pluck and grasp at points as he highlights the significance of specific points in history.

    Until you’ve seen Hans Rosling in action you can have no idea just how moving a bunch of blue bubbles moving down a screen can be.

    The BBC writes that:

    Despite its light and witty touch, the film nonetheless has a serious message – without statistics we are cast adrift on an ocean of confusion, but armed with stats we can take control of our lives, hold our rulers to account and see the world as it really is. What’s more, Hans concludes, we can now collect and analyse such huge quantities of data and at such speeds that scientific method itself seems to be changing.

    "I kid you not, statistics is now the sexiest subject on the planet" says Hans Rosling, presenter of The Joy of Stats.


    Enhanced by Zemanta

  • Capitalogix Commentary for the Week of 08/16/10

    Tracking the Hindenburg Omen: How Much Danger Is There?

    100815 Hindenburg Crash"Friday the 13th" got a little scarier than normal as warnings were heard from many corners of the financial blogosphere that the Hindenburg Omen triggered.

    What is it?  It is a fairly obscure technical analysis pattern, which supposedly gives an early warning of unstable market conditions (and even potentially stock market crashes).

    While the calculation is based on five factors, the primary conditions indicate that there is a big disagreement about market conditions.

    For example, two of the conditions are that a substantial number of stocks have to be at yearly highs, while a substantial number of stocks have to be at new annual lows.  Ultimately, it is hard for those two conditions to be met in a short period of time, unless there's uncertainty in the market.  Moreover, after a rally, uncertainty is often a precursor to a decline.

    In addition, technically (in order for the pattern to be complete), a second sighting of the five elements must occur within 36 days. Logically, lingering uncertainty is a momentum killer.

    While this pattern has correctly predicted every big stock market swoon of the past two decades, including the October 2008 decline (that set the global economic recession into motion), not every Hindenburg Omen has been followed by a crash. Resorting to a geometry analogy: All rectangles are squares, but not all squares are rectangles.

    Personally, I don't make trade decisions based solely on indicators like this. Nonetheless, it has a pretty good track record, seems to be based on reasonable theories, and might be useful as just another data point urging caution.

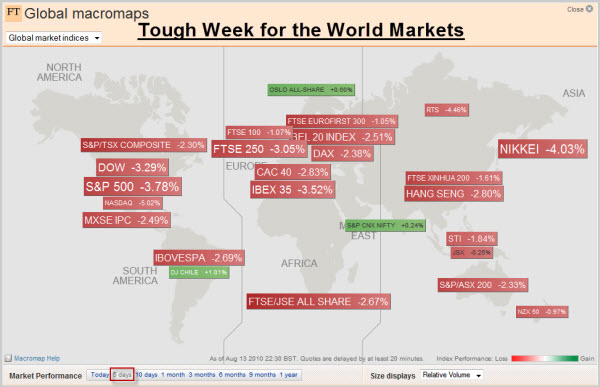
    Tough Week for World Markets.

    Taking a macro view, many markets around the world went down last week.  Notably, the NASDAQ was down 5%, the Nikkei was down 4%, and many other indices were down 3%.

    100813 Tough Week for World Markets

    Here in America, the Federal Reserve’s Open Market Committee startled financial markets by raising its terror alert level over the economy and declaring it would keep buying bonds to maintain its loose-money stance and fight deflation.  Despite the promise of help, the markets continued lower.

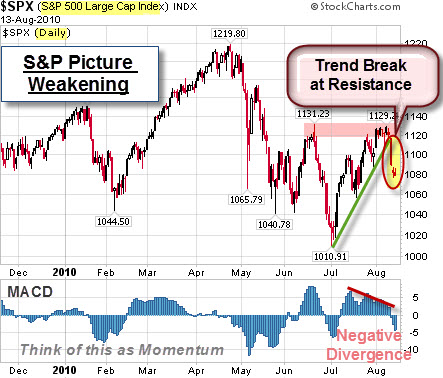
    Let's Look at a Chart of the S&P.

    What does a daily chart of the S&P 500 Index show?  Price has retreated from the resistance area (marked by the pink highlight).  In addition, price has gapped below the up-trend line (marked by the green line).  Combine that with a negative divergence in MACD momentum, and the picture is technically weaker than before.

    100815 SP500 Trend Break

    Bulls are looking for an oversold rally.  Bears are looking at the unfilled gaps as breakaway gaps.

    As always, it should be interesting.

    Business Posts Moving the Markets that I Found Interesting This Week:

    • Goldman Had 10 Days of Trading Losses in Q2. (WallSt&Tech)
    • The Options Market's Take On H-P: Frenzied Buying in Put Options. (Barrons)
    • Grand Tetons Possibly for Sale: Governor of Wyoming Says They Are Desperate. (Alternet)
    • How Far Should Google Go to Profit From the Data It Has About People's Activities? (WSJ)
    • Skype Files Plans for $100 Million IPO. (WSJ)

    Lighter Ideas and Fun Links that I Found Interesting This Week

    • Hedge Fund Predicts "Apple Will Sell 50 Million iPads A Year". (BusinessInsider)
    • Swarm Intelligence: Why Mimicking the Behaviour of Ants & Bees Is Smart. (Economist)
    • What Your Appetite Reveals About How Your Brain Works? (PsychologyToday)
    • BlackBerrys & Encryption – Spies, Secrets and Smart-Phones. (Economist)
    • Google Goggles Lets You Search the Web With Your Mobile Phone Images. (Kurzweil)
    Enhanced by Zemanta

  • Finding Wisdom in Mountains of Data

    In this video, Gary Flake demos Pivot, a new way to browse and arrange massive amounts of images and data online. Built on breakthrough Seadragon technology, it enables spectacular zooms in and out of web databases, and the discovery of patterns and links invisible in standard web browsing.

    The big idea that this video demonstrates so well is that the whole of the data in which we consume is greater that the sum of the parts. And, instead of inducing information overload, new tools enable us to use information so that patterns pop and we can see trends that would otherwise be invisible.

    If we can do that, then, instead of being trapped in data, we might
    actually extract information. And, instead of dealing just with
    information, we can tease out knowledge. And if we get the knowledge,
    then maybe even there's wisdom to be found.

    Click here to view the transcript.

    This tool, and others like it, will have massive impact on businesses
    and the scale of projects they undertake.

    Reblog this post [with Zemanta]
  • Why Cloud Computing Irks Larry Ellison, But Benefits You.

    The network is becoming the computer.

    Here is a short video that puts "Cloud Computing" in perspective.  In it, Ellison jokes that someone decided to change the word "Internet" to
    "Cloud" because it was a lot easier than innovation.


    Microsoft is spending a lot of time and money to make sure it does better gaining an early lead and monetizing this type of "Internet" service.  Their cloud computing platform is called Azure.

    Amazon also has a cloud offering worth a look. 

    Why Should You Care?

    Basically, you can “rent” a current version Windows Server for as little as 12 cents per hour, and only pay for the hours you need it each month. That’s $12 bucks to use 100 servers for an hour. You also pay for data transfer and storage, but that is negligible. The nice thing is that you can fire up an army of servers to run a batch process … then stop paying when they complete their work.

    You can get access even cheaper under a program where you bid on unused capacity within the cloud at any given time (Spot pricing). 

    I still have reservations about using cloud computing for many daily business applications. However, for “crunch on demand” processes … this model makes much more sense that investing in piles of hardware that all too soon becomes obsolete.

    Most of the data from this post comes from Tim McDonald, the president of Infassure, a technology consulting and out-sourcing company in the Dallas area.  They've been a big help to us on this, and many other matters.

  • Review of Alphatrends’ Book on Technical Analysis Using Multiple Time Frames

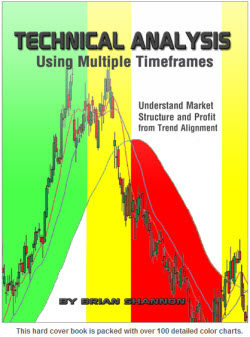
    091115 Technical Analysis Book This is one of the few books that I recommend to traders regardless of
    their expertise. There's something valuable in here for novice traders,
    and perhaps even more for experienced traders.

    The book was written by Brian Shannon. He is a professional trader; and he has developed quite a following on Twitter under the name "AlphaTrends".

    Over the years, I've read many books about trading, the markets, and psychology. This book is a very nice combination of those topics, with some common sense thrown in for good measure.

    What is in the Book?

    The book starts by explaining some basic technical analysis concepts, like trends, moving averages, and support & resistance levels.  Next, Shannon explores some of the common volume and market patterns (dealing with what to expect, and why it happens that way).

    He also talks about the four stages of a stock's economic cycle.
    Whether you call it expansion, peak, decline, and recovery … or …
    accumulation, mark-up, distribution, and decline … these four stages
    show-up repeatedly, in different stocks and on different time
    frames. Recognizing these cycles, and what they mean, is a good step forward in understanding the markets and which techniques are most
    likely to work in a particular market condition.

    The Disciplined Trader.

    Along the way, he also does a nice job pointing out some of the nuances of trading, from risk management to exit strategies.  This is a book that balances opportunity with defense and discipline. 

    I appreciate that the book focuses on the risk management side of trading, and doesn't pretend that there are magic indicators or trading systems. He stresses that risk management and position sizing are more important than what you choose to trade.

    More Than Patterns: The Entry and Exit Matter Too.

    Shannon states that his edge is based on observing the market clearly and objectively, then implementing trades based on what the market dictates. He teaches to initiate a trade only when you have a perceived edge and the price action confirms your theories.

    He warns that the most difficult job on Wall Street is
    picking tops and bottoms.  There are lots of lower risk ways to trade.  For example, while trend following is one of the techniques he advocates, he explains how using multiple time frames helps you identify trend alignment, which you can then use to help place trades during situations where you have a better edge.

    Common Sense Insights About the Markets Isn't as Common You Might Hope.

    As Shannon describes the different patterns, he does a nice job of
    providing charts and narrative to explain what's happening, what some
    buyers might be thinking, and why he takes (or avoids) trades at
    different points in time.

    He cautions that the market is not always rational and "reasons" are often revealed only after price has moved.

    I like that reading this book feels like you're having a conversation
    with someone who really knows what they're talking about.  And as you
    get further through the conversation, you realize that you're making
    progress, learning new things, making new distinctions, and putting
    things together in a way you hadn't thought of before.

    This book doesn't talk down to readers; yet, it doesn't try to dazzle them either. It's well-written, balanced, and full of practical ideas and insights.

    Bottom Line, it's certainly worth reading.

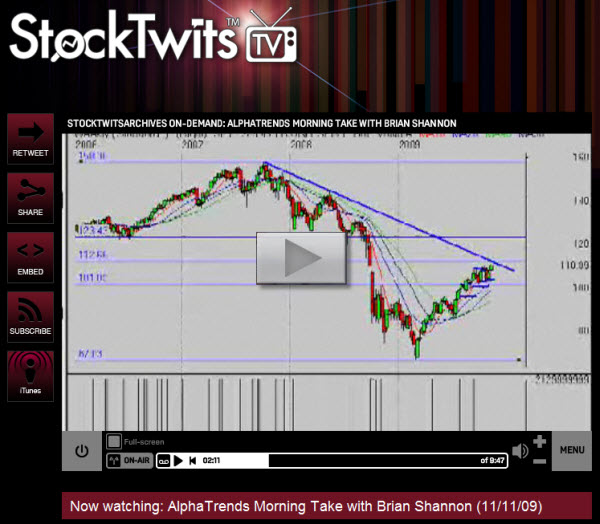
    In addition, click the picture below to watch a recent video he did about what's happening in the market.  It is a nice example of his trading style.

    091115 AlphaTrends Market Commentary

    Brian Shannon Other Resources:

  • Here are the iPhone Business Apps I Use Most

    This week I'm listing the iPhone business and productivity apps that I find worth using.
    Click here to explore last week's list of the fun stuff.

    At first I wanted to create a list of the coolest iPhone apps. However, cool doesn't necessarily mean useful. Instead, this is a list of the applications that I use most. I limited myself to the top two applications per category.

    For more information about these applications, click the links to go to the developer's site.  Even if you don't have an iPhone, check-out the links to see what is
    available.  I am amazed at how much of my computing and basic research
    are now done on my phone (as opposed to laptop or desktop computers).

    Stock Market Info

    090919 iPhone Apps

    Business News

    General News

    Reference

    To-Do Lists

    Calculators

    Conversions

    Ideas

    Travel

    That's it for now.  Let me know if I forgot your favorite or you found something worth sharing.