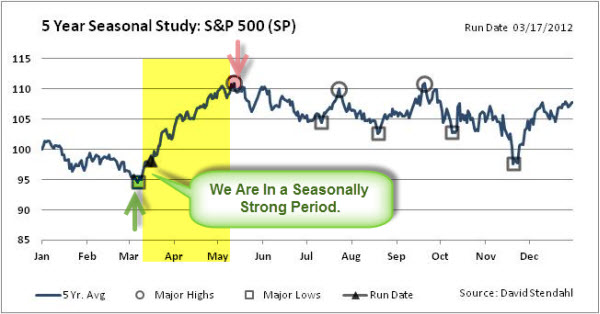
The S&P 500 Index is entering a seasonally bullish period. The chart below shows the predicted turning points based on the past five years of historical data.
Something potentially different this year is that the S&P 500 Index has performed pretty well year-to-date. In fact, it is up 12.17% so far … and things look pretty strong until May.
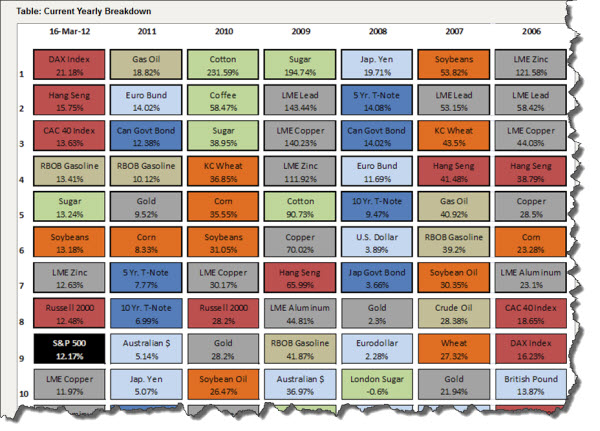
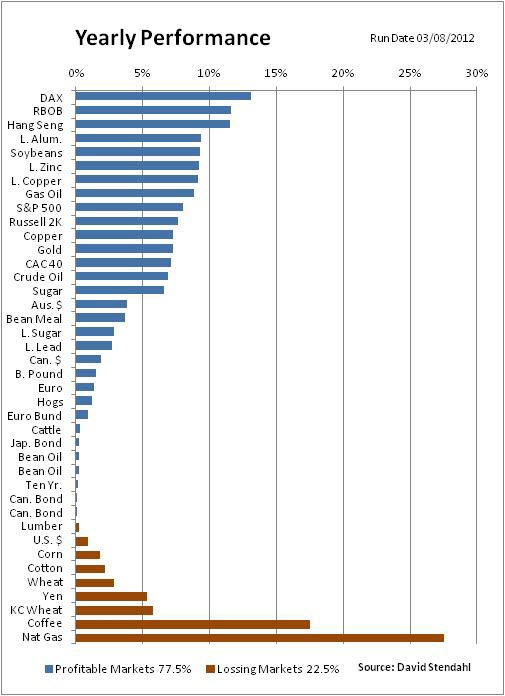
However,the chart below should serve as a reminder that there a lot other markets worth trading too. For starters, the DAX is up 21.18% so far this year.
The chart shows the top-ten performing markets for the past few years. Click the chart to see an expanded version of this data.
Note how much diversification there has been in the top-ten throughout the years.
That is the funny thing about markets … something is always working. The trick is finding it while it's working.
Does a market rally in January imply anything for the rest of the trading year? "As goes January, so goes the year." This particular phenomenon is what is referred to as the January Barometer.
Is it true? I don't know … but it is fun to examine.
Many reputable services report the January Barometer's recent-history success rate at around 75%; so it is at least worth noting.
I was going through some past research and found this chart from Chart of the Day from 2009. It illustrates that the S&P 500 has performed much better (on average) during the months following a January gain. The chart is a few years old, but recent years have followed this trend as well.
John Murphy has a slightly different perspective; he says that what the market does during the first week of the new year often gives a clue about direction for the remainder of the year.
Murphy cites the Stock Trader's Almanac, "S&P gains during January's first five trading days preceded full-year gains 86% of the time". The predictive ability of the month of January is nearly as impressive. "The January Barometer predicts the year's course with a .741 batting average. 12 of the last 14 post-election years followed January's direction" (Almanac).
While the January barometer has a good record of prediction, Carl Swenlin still puts it in the "for what it's worth" column because, while it is interesting to note, it might simply be coincidental. Likewise, Business Insider questioned the significance of this indicator in a note called "Don't Be Fooled By All Of The So-Called Market Wisdom".
Nevertheless, we had a good start to that first week of January here in 2012 – and it has continued. Let's hope it keeps up.
There is a slight, but potentially growing, disconnect between the S&P 500 Index and the Asian stock markets (specifically the Hang Seng).
On Friday the Hang Seng lost 1%. Moreover, looking at the recent price performance action … on a 20 day basis, the Hang Seng acting very different than other world markets.
Signal Financial Group just updated their seasonal chart series for the Hang Seng Index. It indicates that we could be at a turning point, with little upside expected based on historical patterns.
A Little Risk/Reward Exercise in Portfolio Diversification.
If the S&P continues to the upside … the Hang Seng may not follow. Thus, over the next few weeks, some traders may look at a potential Long S&P and Short Hang Seng play.
Just as an example, here is a quick look at a portfolio study covering 6 weeks, comparing the performance of a portfolio based solely on the S&P 500 Index versus a portfolio that is long the S&P (using 90% of capital) and short the Hang Seng (with 10% of capital).
Portfolio Allocation:
Equity Portfolio:
100% Long S&P 500 Index
Mixed Portfolio:
90% Long S&P 500 Index and 10% Short Hang Seng
The chart below provides a basic analysis, identifying the differences between the two portfolios. The chart is divided into three sections: return comparison, risk comparison and portfolio change. The first section shows the percent return figures for the portfolios over a recent six week period. The second section focuses on risk, which is defined as standard deviation of return, over the same six week time period. The final section shows the net percentage change to the portfolio's performance based on the small 10% allocation to Hang Seng.
The diversification helps the risk/reward ratio in the study. That looks like something to watch for in the coming weeks. Hope it helps.