You probably heard that a fake Tweet (claiming that something happened in Washington DC) caused the market to have a mini flash crash this past week. Within minutes of that Tweet on Tuesday, more than $130 billion disappeared from the value of US stocks trading on Wall Street.
Who is to blame … hackers, Twitter, or perhaps algorithmic traders? I don't think so.
After looking at the data, here is a different perspective on what happened … and what I think it means for the future.
Let's assume that a trading algorithm was able
to identify a potential risk (or opportunity) and make a trade based on that information. Once that trade becomes visible to other traders through the open-market system, it's going to trigger a series of causes and effects.
This is no different than when a local on the floor of an exchange places in order during slow market periods to clean out the stops. A spike down beneath people's risk tolerance creates a desire to sell. However, if there is no further selling pressure, the market will rise as traders suspect a 'bargain'. Does that constitute is a micro flash crash also?
The point is that markets are becoming faster and more volatile. It doesn't make sense to complain every time something like this happens. It's going to happen with increasing frequency.
This is now part of the market; consequently, it is time to figure out what to do with it. Some traders will move to faster and more responsive algorithms. Other traders will increase the time-frame that they focus on in order to filter out the "noise" and small variations like this constitute.
Whining about it and calling for increased regulation may be missing the point as well. Why? Because there is a financial incentive for algorithmic traders to become better at correcting these errors themselves. Frankly, it's too expensive to be wrong for long (especially when your trading large-size). As a result, the algorithms are going to get better at the 'two steps forward, one step back' testing and evaluation process. It's inevitable.
Trading isn't about predicting the future. It's about calculating the probabilities better. By doing this you can know faster and act
faster. This will likely result in smaller errors – and (if you care) the markets will seem more orderly. Nevertheless, what it really means is more ways to win for people who can spot the opportunities quick enough to take advantage of them.
There was finally an uptick in securities reaching new 52-week lows this week. Don't get excited; but it had been more than 100 days since we'd seen at least 3% of issues on the NYSE tick at a 52-week low.
Meanwhile, other indicators of where we are on the risk-on/risk-off spectrum have been pointing 'bearish'. For example, the following chart shows that the Russell 2000 Index is under-performing the S&P 500 on a relative basis.
Obviously, Gold is leading the bearish pack downwards. Traders may note that Gold has support at 1472.90 (with more support at 1382.92). Its most recent close was 1501.40.
The Internet currency, Bitcoin, has seen an uptick recently as more people look to the virtual currency as a way to get rich or avoid the problems of fiat currency.
Bitcoin was created in 2009 by "Satoshi Nakamoto" — almost certainly a
false name — in order to be anonymous currency, easy to use,
self-regulating, and free from any central authority.
People are starting to realize they can now put their money in the cloud and access it anywhere, from any computer. As a result, the value of bitcoins is rsing.
Two months ago, one bitcoin hovered in the $10 to $15 range, and a $30 peak was considered ludicrously high. What about now?
The surging valuation suggests that people are starting to see ways to use it to create and protect value.
Bitpay, a company that facilitates bitcoin transactions, logged over $5 million worth
of transactions in March alone, as people traded bitcoins for tangible
items, mostly high-end electronics and precious metals.
Expect to hear a lot more about this in the media.
The Merrill Lynch Fund Managers Survey shows growing confidence and risk-taking. A quick glance revealed a number of interesting charts and insights. For example, the chart below shows what has happened, historically, when liquidity conditions hit the levels they are at now.
Retail investors love the good days, but traders suspect that the end is near when it gets like this. Click here to see more from the Survey.
Keep in mind, Price is the primary indicator. You've got to trade the
conditions as they are … not assuming that they are better or worse
than they really are.
Have you been waiting around to "buy the dip" on this latest stock market rally?
If so, you have been waiting a long time. And I'm not just talking about the recent 10-day winning streak.
The Dow surpassed its all-time high and the S&P 500 is not that far from the tops of 1553 on March 24, 2000 and 1576 on October 9, 2007.
How Strong is the Trend?
The chart below compares each of the equity markets. If a market is
shown to be at 100%, then it's currently at a new three year equity
high. If not, then the percentage number indicates how close it is to
reaching a new equity high.
Also visit the Drawdowns Metric page to view historic equity high watermark charts.
Similar to 2000 and 2007, the economic, valuation and political background does not seem to support the budding euphoria.
But, as Citigroup's CEO said in 2007: “… as long as the music is playing, you’ve got to get up and dance. We’re still dancing.” Remember how well that turned-out?
The benchmark Index extended its rally to eight days.
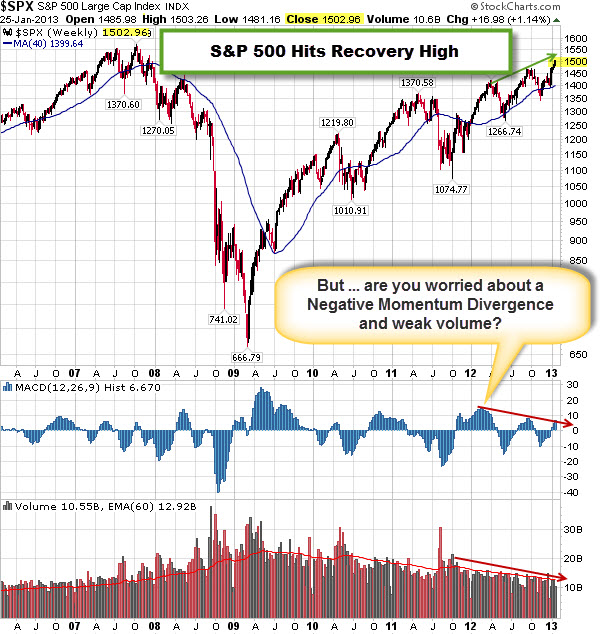
This winning streak is the longest in eight years and left the S&P 500 just 4% beneath its all-time closing high of 1,565.15 (set on October 9, 2007).
Meanwhile, some technicians will note the less than enthusiastic volume and the negative divergence (where recent price highs happened with lower momentum). These are often taken as early topping indicators (or signs of weakness).
Apple's stock has now dropped 37% since its September high of $702.10.
As a result, Exxon reclaimed its status as the world's most valuable company.
Do you attribute this to Apple's weakness … or an early warning that 'smart-money' is taking risk off the table?
Remember: Price is the Primary Indicator.
What do you think is the most bullish indicator of our markets?
It's not a trick question; the answer is "price". Despite the uncertainty about the economy, the markets have held-up nicely throughout this rally. And that, in-and-of-itself, is bullish.
It doesn't matter what technical analysis indicator you use (increasing negative divergences and selling on down days … or less positive momentum and market breadth), the markets have given us a clear message recently. Price is the primary indicator, and it has stayed above support.
Traders learn strong uptrends tend to trump bearish divergences. But it bears watching.


