Market Commentary

  • AI & Intellectual Property With Rich Goldstein

    It has been a crazy ride.

    I studied psychology and philosophy at Duke in the early '80s.  Then I got both an MBA and a law degree at Northwestern University in Chicago. 

    My first job out of school was doing corporate and securities work at a law firm in Dallas.  By the early '90s, I knew that I was an entrepreneur. 

    Regardless, the path seemed random as I was going down it … but looking back, it all seems to make some form of sense. 

    I recently did a podcast with a patent lawyer friend, Rich Goldstein. We talk about that, what it's like working with my son, the difference between practicing law and creating AI, innovation, and the role of Intellectual Property and its protection. 

    I think it's a good listen. Check it out


  • The State of Democracy

    I feel very lucky to live in America and lucky to live in a democracy … but democracy is a term that encompasses a wide spectrum of activity and governments. In the same way that Republics and Capitalism also represent a wide spectrum of activity.

    America has adopted a form of all three of those underlying structures, but it changes with each regime change, and as we adapt to the complexities of modern-day civilization.  

    It's worth understanding the nuances of what brand of democracy you live in – and what would make it ideal (in your opinion).

    That's a much too complicated question to answer in the scope of this article, but a great starting point is understanding the world spectrum of Authoritarian -> Full Democracy, and how the different countries score. 

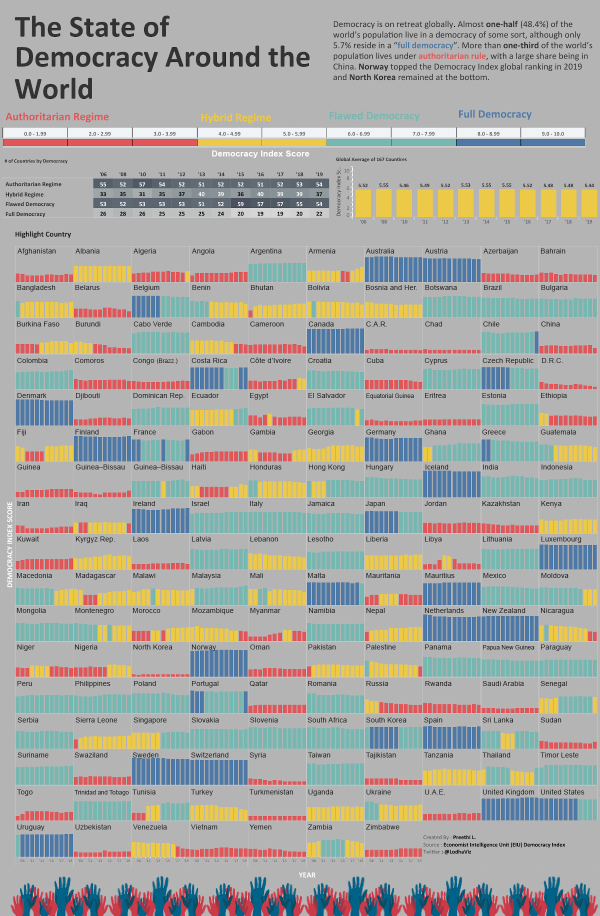
    Luckily, visualcapitalist put together a great interactive graphic based on the Democracy Index global ranking (as of 2019). Click the image to see the interactive version.

    State-of-democracy-1200-1

    via visualcapitalist

    Before I get into the rankings, a quick look at the classifications within the Democracy Index. It bases the score on 60 questions that cover things like the electoral process, civil liberties, government functions, and political culture. 

    • Authoritarian Regime: 0.0 – 3.99
    • Hybrid Regime: 4.0-5.99
    • Flawed Democracy: 6.0-7.99
    • Full Democracy: 8.0 – 10.0

    Topping the list is Norway, and the most Authoritarian regime is North Korea.

    Unfortunately, based on this metric, the U.S. (which is one of the oldest democracies in the world) was downgraded to a flawed democracy as of 2016, after teetering for many years. Some stated reasons for this shift are the growing distrust in public institutions, an upshot in ideological purity, and less bipartisan efforts. 

     Since 2006, when the Index was created, Democracy has actually been decreasing globally. Today, around half of the world's population lives in a democracy of some sort, with only 5.7% living in a "full democracy". 

  • Innovator Mindsets

    To some, new technology is a good thing.  To others, less is more.

    Most people simply "tolerate" technology transitions, some people drive them, and others crave them and use them as a catalyst for growth or strategic advantage.

    640px-Diffusionofideas
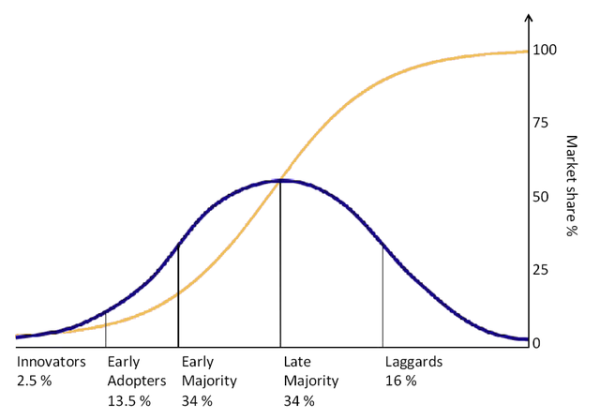
    In the image, above, the blue line represents consumer adoption (taken from Geoffrey Moore's "Crossing the Chasm", while the yellow line represents market share. 

    As you can see, only 2.5% of the population drive innovation (or adopt it early enough to help drive the Alpha & Beta versions of emerging technologies). 13.5% make up the Early adopters, who help get it ready for the mainstream.  Then the early and late majorities are the groups that ultimately consume (or use) the mature product. Meanwhile, Laggards are often forced kicking and screaming into “new” technologies as the early adopters are well on their way to subsequent iterations. 

    Even if you are not an innovator, here are a few Innovator Mindsets that I find useful. 

    1. You Believe There’s A Better Way
      • Wherever you are, you know that there is a best next step and you are eager to find it and take it.
      • You recognize that the opportunity for more (or better) often lies just beyond the constraints or problems of the current way.
      • The bigger future fuels your efforts. When initial excitement fades, understanding what the bigger future can bring helps you power through.
    2. You Are Comfortable Being Uncomfortable
      • You understand that Pioneers sometimes take arrows in the back.
      • When creating a new reality, you expect some resistance as a result of the law of averages. Escaping the status quo takes a lot of momentum, but it’s worth it. 
      • You recognize when victory is near.  In a quirk of human nature, too many people quit just before they would have won. Don’t make that mistake.
    3. You Know Where You're Going, Even If You Are Not Sure How You're Going To Get There
      • Your goal should be your North Star. A clear direction is important to ensure that activity leads to progress.
      • Measure progress and momentum rather than the distance from your goal.
      • It is easier to course-correct while in motion.
      • If you’re too committed to a path that isn’t leading in the right direction, you might find what Blockbuster, RadioShack, and Kodak found.
    4. You Are Married To Questions (Not Necessarily Answers)
      • Everything works until it doesn’t; and nothing works forever.
      • It’s easy to find an answer and think it’s the right one, but there’s always a best next step or a better way.
      • Figure out what you want and how to get it. This is much more empowering than focusing on what you don’t want or why you can’t get it.
      • Ask questions that focus on opportunities or possibilities rather than challenges or what you want to avoid.
      • Energy flows where focus goes.
      • Commit to finding a way!

    I plan on sharing more Innovator Mindsets.  Let me know what you think.

  • Feast on This: The Big Mac Index

    In the past, I've shared various "indicators" for markets that just don't make sense — like the Superbowl Indicator. The lesson to learn from those indicators is that we crave order, and look for signs that make markets seem a little bit more predictable even where there are none. 

    Wall Street is, unfortunately, inundated with theories that attempt to predict the performance of the stock market and the economy. More people than you would hope, or guess,  attempt to forecast the market based on gut, ancient wisdom, and prayers.

    While hope and prayer are good things … they aren’t good trading strategies.

    Today, I want to talk about a still "out there" index, but one that's a bit more practical from an economics standpoint (remember economics ≠ markets). I don't believe it should influence trading decisions, but I do believe it can teach you something about the practical realities of economies. 

    The Economist's Big Mac index seeks to make exchange-rate theory more digestible.  They say it is arguably the world's most accurate financial indicator (based on a fast-food item).

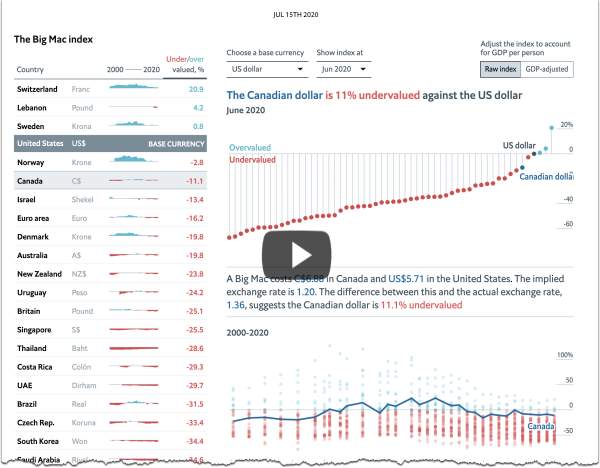
    The Big Mac index is based on the theory of purchasing-power parity (PPP), according to which exchange rates should adjust to equalize the price of a basket of goods and services around the world. For them, the basket is a burger … a McDonald’s Big Mac. The difference the disparity in price between Big Macs, and the actual exchange rate lets you know whether the currency is over or undervalued. 

    According to this measure (as of July 15th, 2020), the most overvalued currency is the Swiss Franc at 20.9% above it's PPP rate. In Switzerland a Big Mac costs 6.50 francs. In the U.S. a Big Mac costs $5.71. The implied exchange rate is 1.14, and the actual exchange rate is 0.94 — thus 20.9% overvalued. For contrast, South Africa Rands are the most undervalued (67%) with a Big Mac costing 31 rand and an actual exchange rate of 16.67. 

    Click the image below to see the interactive graphic.

    Screen Shot 2020-09-06 at 11.19.19 AM2via The Economist

    The index is supposed to be a guide to the direction in which currencies should, in theory, head in the long run. It is only a rough guide, because its price reflects non-tradable elements ­such as rent and labor. For that reason, it is probably least rough when comparing countries at roughly the same stage of development.

    It is not meant to be the most precise gauge, but it works as a global standard because Big Macs are global and it's lighthearted enough to be a good introduction for college students learning more about economics. 

    You can read more about the Big Mac index here or read the methodology behind the index here.

  • Gartner’s 2020 Hype Cycle For Emerging Technologies

    Each year, I share an article about Gartner's Hype Cycle for Emerging Technologies. It's one of the few reports that I make sure to track every year. It does a good job of explaining what technologies are reaching maturity, but which technologies are being supported by the cultural zeitgeist. 

    Technology has become cultural. It influences almost every aspect of every-day life, and it's also a massive differentiator in today's competitive landscape. 

    Sorting through which technologies are making real waves (and will impact the world) and which technologies are a flash in the pan, can be a monumental task. Gartner's report is a great benchmark to compare reality against. 

    2019's trends lead nicely into 2020's trends. While there have been a lot of innovations, the industry movers have stayed the same – advanced AI and analytics, post-classical computing and communication, and the increasing ubiquity of technology (sensors, augmentation, IoT, etc.). 

    What's a "Hype Cycle"?

    As technology advances, it is human nature to get excited about the possibilities and to get disappointed when those expectations aren't met. 

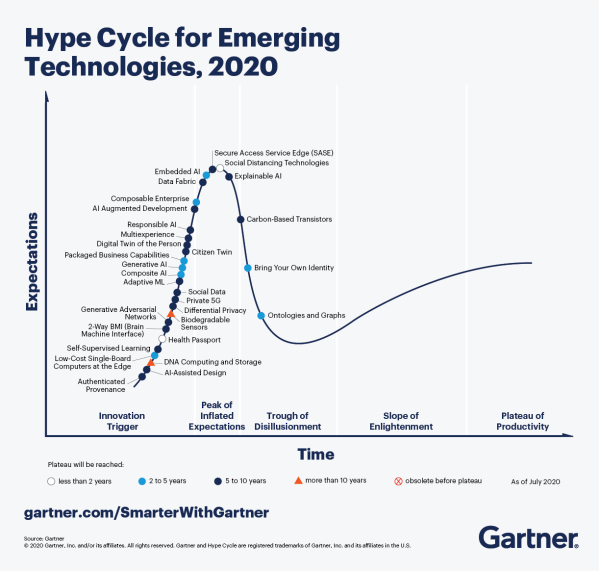
    At its core, the Hype Cycle tells us where in the product's timeline we are, and how long it will take the technology to hit maturity. It attempts to tell us which technologies will survive the hype and have the potential to become a part of our daily life. 

    Gartner's Hype Cycle Report is a considered analysis of market excitement, maturity, and the benefit of various technologies.  It aggregates data and distills more than 2,000 technologies into a succinct and contextually understandable snapshot of where various emerging technologies sit in their hype cycle.

    Here are the five regions of Gartner's Hype Cycle framework:

    1. Innovation Trigger (potential technology breakthrough kicks off),
    2. Peak of Inflated Expectations (Success stories through early publicity),
    3. Trough of Disillusionment (waning interest),
    4. Slope of Enlightenment (2nd & 3rd generation products appear), and
    5. Plateau of Productivity (Mainstream adoption starts). 

    Understanding this hype cycle framework enables you to ask important questions like "How will these technologies impact my business?" and  "Which technologies can I trust to stay relevant in 5 years?"

    That being said – it's worth acknowledging that the hype cycle can't predict which technologies will survive the trough of disillusionment and which ones will fade into obscurity. 

    What's exciting this year?

    Before I focus on this year, it's important to remember that last year Gartner shifted towards introducing new technologies at the expense of technologies that would normally persist through multiple iterations of the cycle. This points toward more innovation and more technologies being introduced than in the genesis of this report. Many of the technologies from last year (like Augmented Intelligence, 5G, biochips, the decentralized web, etc.) are represented within newer modalities. 

    It's also worth noting the impact of the pandemic on the prevalent technologies. 

    For comparison, here's my article from last year, and here's my article from 2015. Click on the chart below to see a larger version of this year's Hype Cycle.

    Zz1lNWZiNWRjMmRlNWIxMWVhYjFjMjBlNjhjZDJlOWEzMw==

    via Gartner

    This year's ~30 key technologies were selected from over 2000 technologies and bucketed into 5 major trends:

    • Composite Architectures represent the organizational shift to agile and responsive architectures due to decentralization and increased volatility. Emphasis is on modularity, continuous improvement, and adaptive innovation to respond to changing market conditions (like in trading, or in businesses rapidly shifting to remote). Sample technologies include embedded AI and private 5G
    • Algorithmic Trust is a direct result of increasing data exposure, fake news, and biased algorithms. As a result, technologies have been built to "ensure" identities, privacy, and security. A great example is more technologies being created on the blockchain. Other examples include explainable AI and authenticated provenance
    • Beyond Silicon is in its infancy, but represents the limitations of Moore's law and the physical of silicon. This has led to new advanced materials with enhanced capabilities being used, and other simple materials being used. Examples of this technology can be seen in  DNA computing and storage, quantum computing, and biodegradable sensors
    • Formative AI is the shift towards more responsive AI; models that adapt over time and models that can create novel solutions to solve specific problems. Sample technologies include generative AI, self-supervising learning, and composite AI. 
    • Digital me represents the integration of technology with people, both in reality and virtual reality. Past hype cycles have introduced implants and wearables, but the potential applications of the technology are growing, especially in response to social distancing.  Examples are health passports, Two-way BMI, and social distancing technologies

    I'm always most interested in the intersection of AI and advanced analytics. This year, it looks like many of the fledgling AI technologies have become integrated and more advanced. Much like the formative years for children, formative AI represents a new era in AI maturity. Models are becoming more generalized, and able to attack more problems. They're becoming integrated with human behavior (and even with humans as seen in digital me). 

    As we reach new echelons of AI, it's actually more likely that you'll see over-hype and short-term failures. As you reach for new heights, you often miss a rung on the ladder… but it doesn't mean you stop climbing. More importantly, it doesn't mean failure or even a lack of progress.  Challenges and practical realities act as force functions that forge better, stronger, more resilient, and adaptable solutions that do what you wanted (or something better).  It just takes longer than you initially wanted or hoped.

    To paraphrase a quote I have up on the wall in my office from Rudiger Dornbusch … Things often take longer to happen than you think they will, and then they happen faster than you thought they could. 

    Many of these technologies have been hyped for years – but the hype cycle is different than the adoption cycle. We often overestimate a year and underestimate 10. 

    Which technologies do you think will survive the hype?

  • Data Really Is Beautiful

    I think most data scientists or traders would agree that some charts are just prettier than others.

    Whether it's due to the artistry of the creator, the results shown, or an insight or perspective illuminated … I am sometimes surprised by the beauty of a chart. 

    After looking at thousands of charts, some really do look "pretty" and others look "ugly" to the trader.  Perhaps this stems from an intuition honed through many trials of separating luck from skill?

    Taking a different approach is Stoxart, created by a visual designer at Nike named Gladys Orteza.  She has been turning stock charts into landscape artworks related to the company they reference.  All that's missing is the warning that past performance doesn't guarantee future results.

    Here is an example of her art inspired by Ford's performance in the last year.  Maybe she should have titled it "Sunset".

    Rbdvb8qjsog51via LLMoonJ

     Another fun one is a year of Tesla performance. 

    Bl7sl41e7ff51via LLMoonJ

    Here's a link to see more Stoxart

  • My Talk With The Sustainable Family Wealth Summit

    I recently had the chance to speak at a wealth summit helping to educate family offices on the different opportunities available to them. Because of my work around the hedge fund space – and with emerging technologies like AI – I was brought in to focus on both topics for their audience.

    The financial industry is intimidating – especially to newcomers – and while this summit is targeted towards family offices with $5MM+ in liquid assets, the lessons are accessible to any level of wealth. 

    The presentation was somewhat of a departure from my normal talking points because it was more focused on the basics of hedge funds & trading in general.  Nonetheless, I think it's worth watching.  This clip shows my response to the moderator's previous presentation.  The presentation provides an introduction to hedge funds and alpha generation now and into the future.  We also talk about Madoff, performance fees, the 2008 crash, "why a hedge fund?" and a lot more. 


    Hope that helped.  Let me know what you think.


  • The Disconnect Between the Stock Market and Consumers

    The recent shutdown has brought light to the disparity between markets and economics, and also served to widen the relationship. 

    In high school, most of us were taught basic supply and demand. Some probably took a macroeconomics course, fewer got an MBA, and I know some of you reading this are actual economists or traders. 

    Yet, most people (even some economists) misunderstand what drives financial markets. 

    Image1_1600x900-640x360

    In theory, share price is supposed to be the net present value of the future earnings stream.  This is a "weighing" mechanism that also balances positives and negatives, short-term and long-term issues, industry cycles, fundamental data, and a host of other issues.

    The markets represented the collective fear and greed of a population.  A trader doesn't need to guess what someone specific is going to do … their calculus is more about the law of large numbers.  How will most people respond to a sudden move up or a sudden move down?  Will they see it as a danger or an opportunity?

    In a sense, markets operate like an actuary for an insurance company.  Actuaries don't need to know when you will die, specifically, but rather if they insure 10,000 people like you, how many are likely to die this year (and what premium can they charge to cover the death benefits to be paid, the cost of operations, plus their intended profit margin.

    In the basics of economics, markets and their consumers play a sort of tug-of-war until an equilibrium is set. Price represents the amount of money a consumer is willing to pay for this good (or a comparable good) and the amount of money a seller is willing to sell it for taking into account overhead, manufacturing, time-value, etc. 

    It's not necessarily the maximum cost a consumer would pay and minimum a seller would sell, but for the sake of this discussion, that nuance isn't overly important. 

    The markets were an important price discovery tool using "open outcry" as a way to see at what price others were willing to buy or sell.

    As markets got faster and transactions stopped being generated solely by people trading with people, the pricing mechanism changed.  I think of it as a fair value range surrounded by a fair speculation buffer.  As markets get faster, noisier, and more volatile, the fair speculation range expands.  That means pricing is more dynamic and edges decay faster than ever.

    This also means that less of the price is based on simple things, like whether the economy is improving or declining.  As we've seen, markets can soar even when economies face serious existential threats.

    Market structure, today, involves many more players investing for many different reasons. Gone are the days when the market waited with bated breath for Fed conferences, earnings reports, and presidential updates. Instead, you have speculators, passive investors, fundamental investors, quantitative investors, companies trying to hedge bets, market makers, manipulative algorithms, governments, and more … all involved in trench warfare seeking an edge. 

    They trade for different reasons – some may make sense logically to you, others are executing part of a strategy you may never figure out. But, together, they form the engine that powers the market.  Markets really are a collection of forces all focused on trading.

    Simplifying, you can look at the decline in the economy compared to the relative stability of the stock market (in light of the world shutting down), as proof of this. Economic stimulus played a massive role in propping up the market, but so did the comparative variety in why market participants trade. It's why you still see liquidity in the markets despite the decrease in consumer confidence and economic activity.  

    Sure, the government created increased liquidity, stimulated markets, and even participated directly (and indirectly) at plunge protection.  But that is the playing field all traders have to play on right now.  It doesn't matter if it reflects the realities you see in the economy or the world.

    Today's markets are much more complicated than before.  Moreover, the vast amount of information available (whether true, false, relevant, irrelevant, clarifying, or misleading) creates a vast signal-to-noise ratio challenge.  Meanwhile, many market participants (like many day-traders) have simply ridden the wave here, though it's unlikely that a vast majority of them truly understand what they're doing. Think of this as the "Smart Money" versus "Dumb Money" … and it doesn't usually end well for one of them.

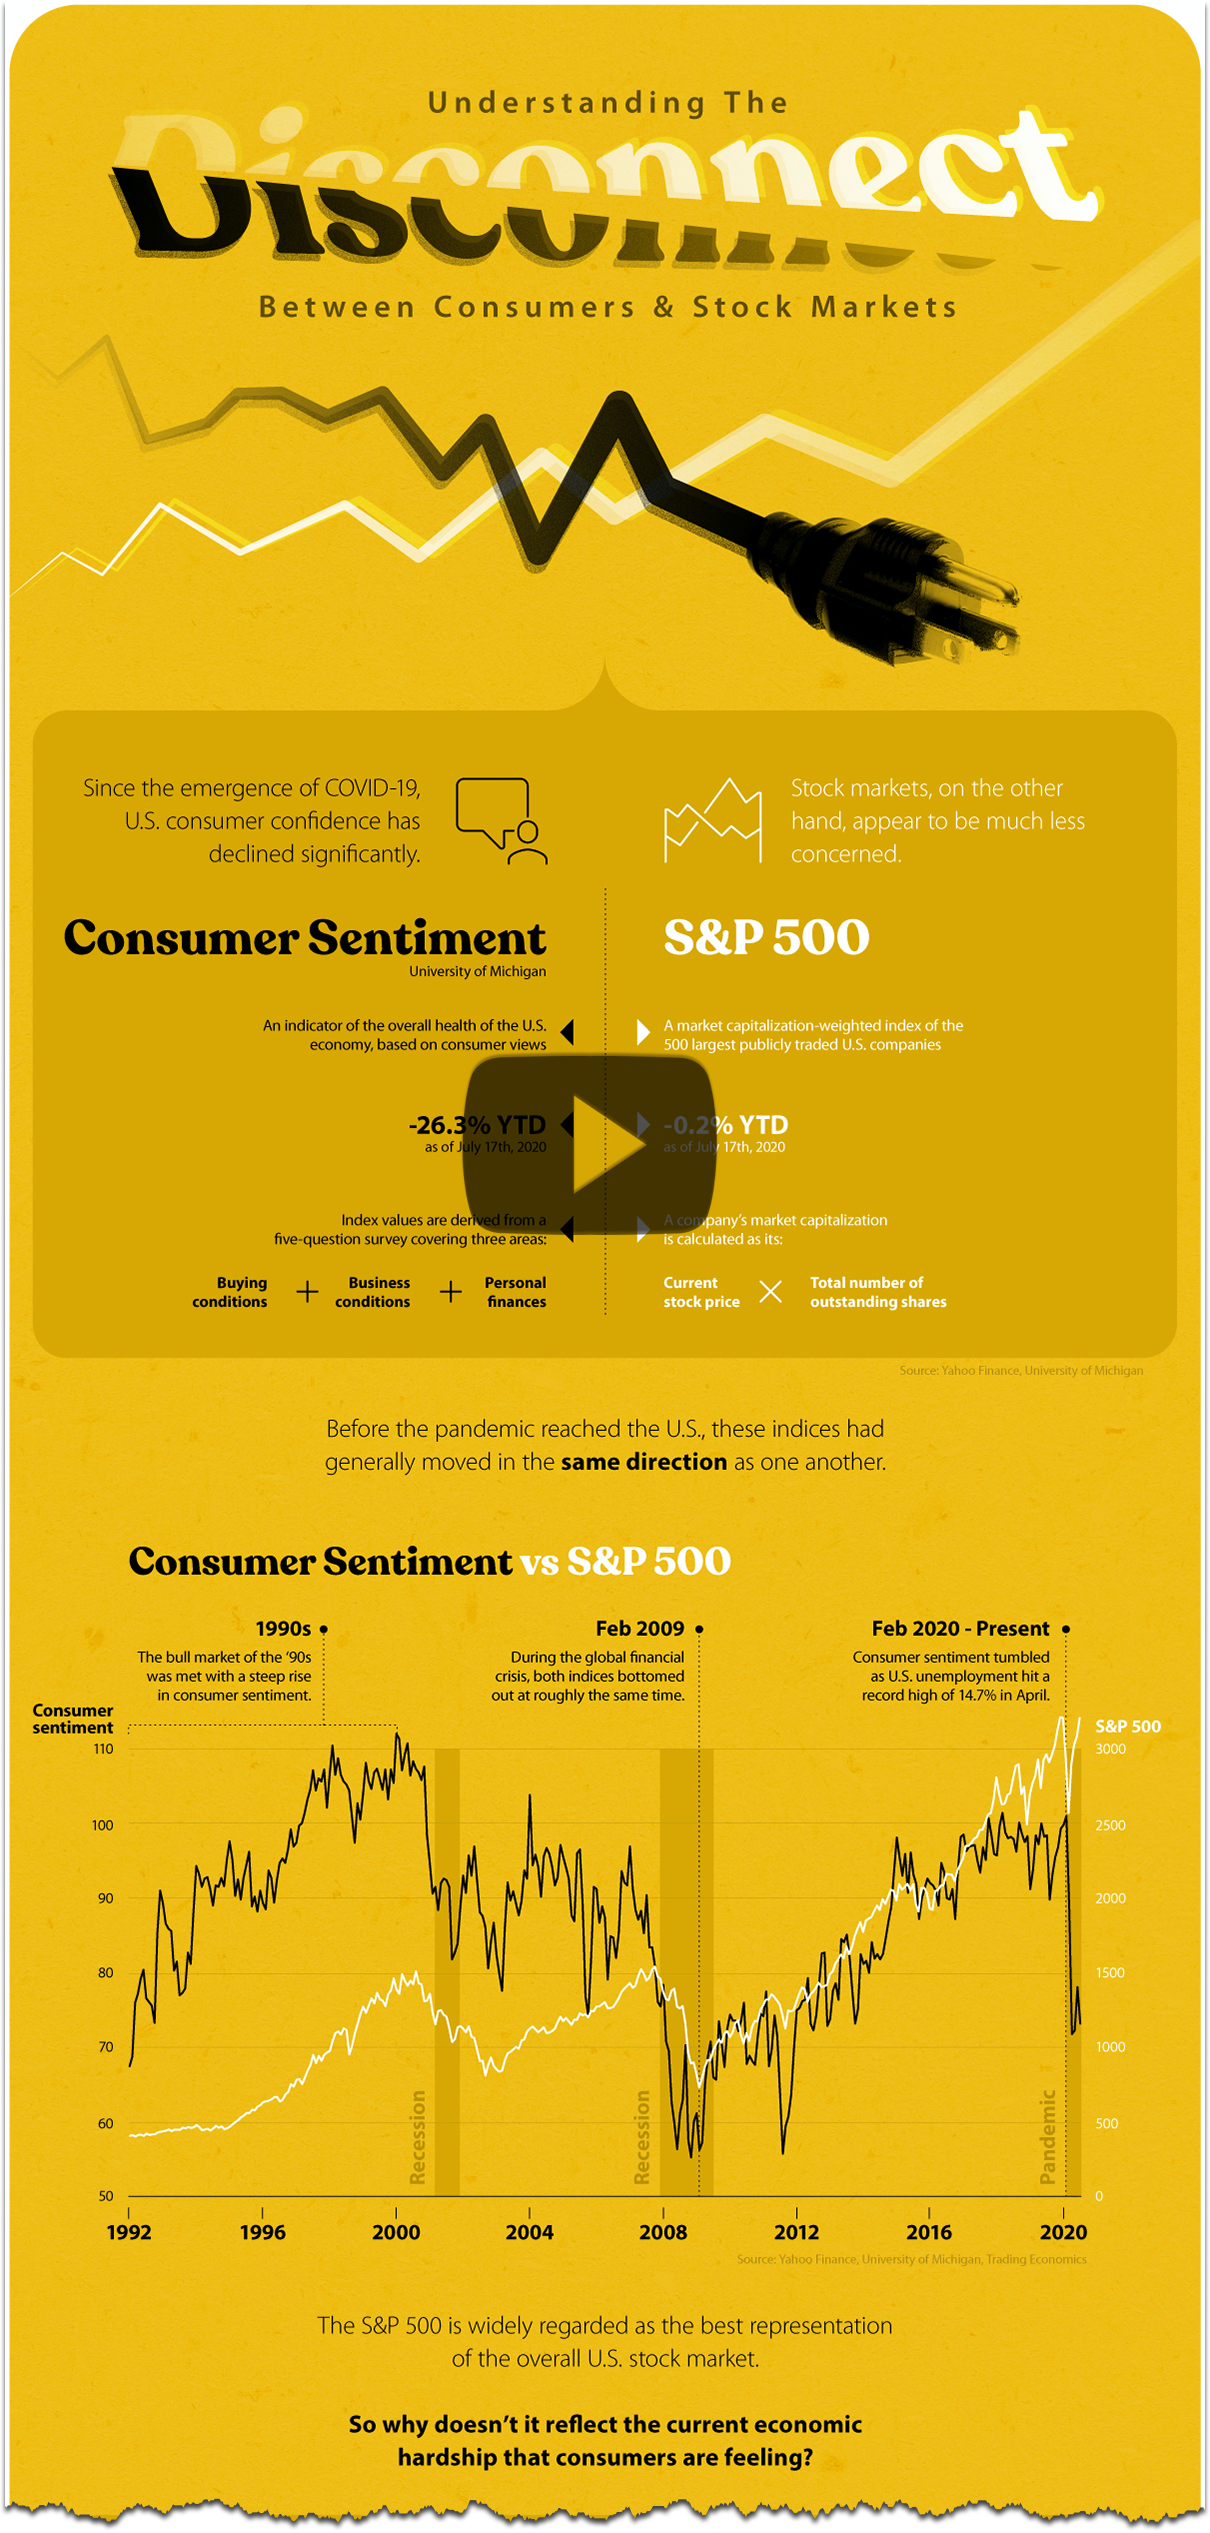
    VisualCapitalist put together a great infographic looking at the difference in response to the shutdown via economic activity and the S&P 500 as of July 17th. 

    Take a look. 
    Understanding-the-Disconnect2via visualcapitalist

    The chart makes the valid point that the S&P 500 is not an equally-weighted index and is currently driven primarily by the tech giants, even with other industries struggling. 

    Consumer sentiment is still a factor, and news cycles can absolutely still impact stocks, as evidenced by Kodak's meteoric growth (and subsequent decline) last week. 

    All-in-all, there are lots of things influencing markets besides the economy. It is a lot to take in (especially for us humans who can only process seven things plus or minus two at any one time.

    It is no wonder that Smart Money is relying more on exponential technologies (like AI and Big Data).

    Be safe!

    Onwards! 

  • Fueling Alpha: A Revisitation

    Last year, around this time I shared an article on data as the new precious commodity. In case you missed it, I thought it was worth revisiting. The closing feels even more relevant today than when I wrote it. Below is the article in its entirety


    Data is becoming a precious commodity.

    A staggering 90% of all the world’s data (2.5 quintillion bytes per day) has been created in the past two years alone … and its value is rapidly rising.

    With IoT growing from 2 billion devices in 2006 to a projected 200 billion by 2020 you can expect to see that growth continue to explode.

    Data is today’s “wild west” and the battlefield of today’s tech titans. 

    AlphabetAmazonAppleFacebook, and Microsoft all have an unprecedented amount of data (and power).

    Rapid growth means little time to create adequate rules. Everyone’s jumping to own more data than the next and to protect their own data from prying eyes.

    I see it in trading, but it’s pervasive in every industry and in our personal lives. 

    Having basic data and basic analytics used to be enough, but the game is changing. Traders used to focus on price data, but now you’re seeing an influx of firms using alternative data sets to find an edge. If you’re using the same data sources as your competitors and competing on the same set of beliefs, it’s hard to find a sustainable edge. Understanding the game they’re playing, and their rules are important, but that’s table stakes.

    Figuring out where you can find extra insight, or where you can make the invisible visible, creates a moat between you and your competition, and it lets you play your own game.

    I shot a video where I talk high-level about Data as fuel for your business. Check it out.


    It is interesting to think about what’s driving the new world (of trading, of technology, of AI, etc.) and that often involves identifying what drove the old world. History has a way of repeating itself.

    Before e-mails, fax machines were amazing. Before cars, you were really happy with a horse and buggy.

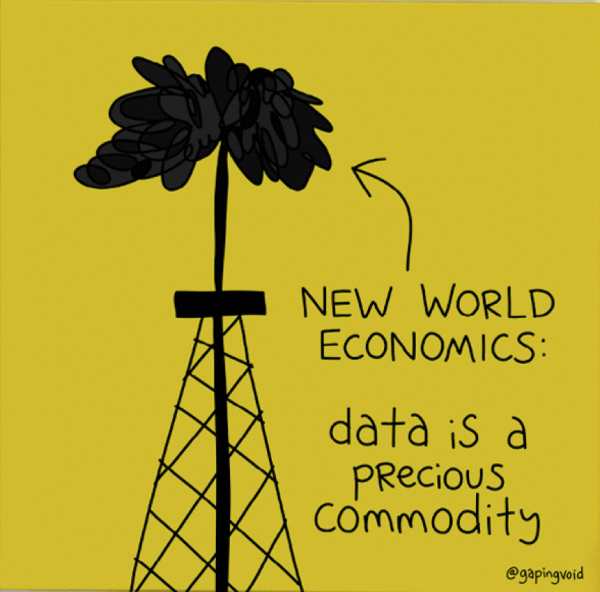
    It’s in these comparisons that I think we can help explain the importance of data in today’s new world economics.

    New World Economics Data Is A Precious Commodity_GapingVoid

    via gapingvoid

    Data as the New Oil

    Petroleum has played a pivotal role in human advancement since the industrial revolution; it fueled (and still fuels) our creativity, technology advancements, and a variety of derivative products. There are direct competitors to fossil fuels that are gaining steam, but I think it’s more interesting to compare petroleum to data due to their parallels in effect on innovation.

    The process of pumping crude oil out of the ground and transforming it into a finished product is far from simple, but anyone can understand the process at a high-level. You have to locate a reservoir, drill, capture the resource, and then refine it to the desired product – heating oil, gasoline, asphalt, plastics, etc. 

    The same is true for data.

    You've got to figure out what data you might have, how it might be useful, you have to figure out how to refine it, clean it, fix it, curate it, transform it into something useful, and then how to deliver it to the people that need it in their business. And even if you've done this, you then have to make people aware that it's there, that it's changing, or how they might use it. For people who do it well, it's an incredible edge. – Howard Getson

    Data can be seen as the fuel to the information economy and oil to the industrial economy. The amount of power someone has can be correlated to their control of and access to these resources … and, leaking of these resources can lead to extreme consequences.

    Why Data Is Better Than Oil

    The analogy works, but it’s just that, an analogy, and the more you analyze it, the more it falls apart. Unlike the finite resource that is oil, data is all around us and increasing at an exponential rate, so the game is a little different:

    • Data is a renewable resource. It’s durable, it’s reusable, and it’s being produced faster than we can process it.
    • Because it’s not a scarce resource, there’s no urge to hoard it – you can use it, transform it, and share it knowing that it won’t diminish.
    • Data is more useful the more you use it.
    • As the world’s oil reserves dwindle, and renewable resources grow in popularity and effectiveness, the relative value of oil drops. It’s unlikely that will happen to data.
    • Also, while data transport is important, it’s not expensive the way oil is. It can be transported and replicated at light speed.

    Using alternative data gives traders an advantage, but it doesn’t always have to be confidential or hard to find information. Traders now have access to vast amounts of structured and unstructured data. An important source that many overlook is the data produced through their own process or the metadata from their own trades or transactions.

    In the very near future, I expect these systems to be able to go out and search for different sources of information. It's almost like the algorithm becomes an omnivore. Instead of simply looking at market data or transactional data, or even metadata, it starts to look for connections or feedback loops that are profitable in sources of data that the human would never have thought of. – Howard Getson

    In a word of caution, there are two common mistakes people make when making data-driven decisions. First, people often end up slaves to the data, losing focus on the bigger picture. Second, even the most insightful data can’t predict black swans. It’s important to exercise caution.

    The future of data is bright, but it’s also littered with potential challenges. Privacy concerns and misuse of data have been hot button topics, as have fake news and the ability of systems to generate misleading data. In addition, as we gain access to more data, our ability to separate signal from noise becomes more important.

    The question becomes, how do you capitalize on data, without becoming a victim to it? 

    Food for thought!