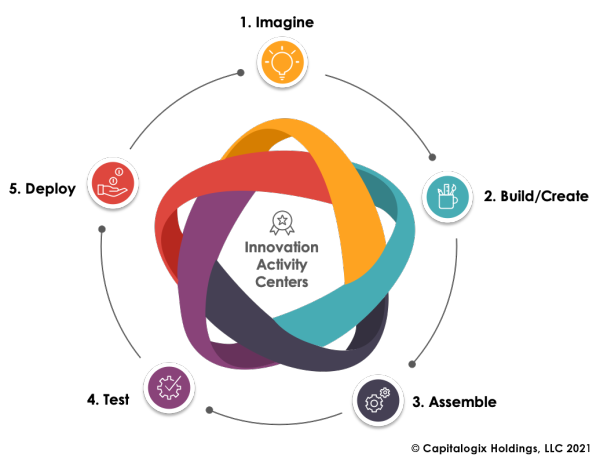
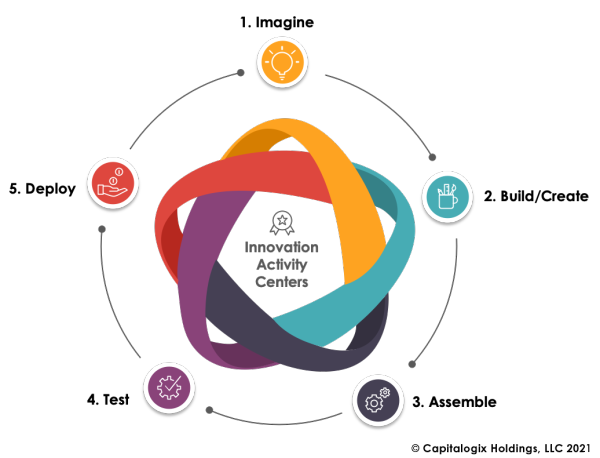
Two weeks ago, I introduced Innovation Activity Centers which are the building blocks for my technology adoption model.
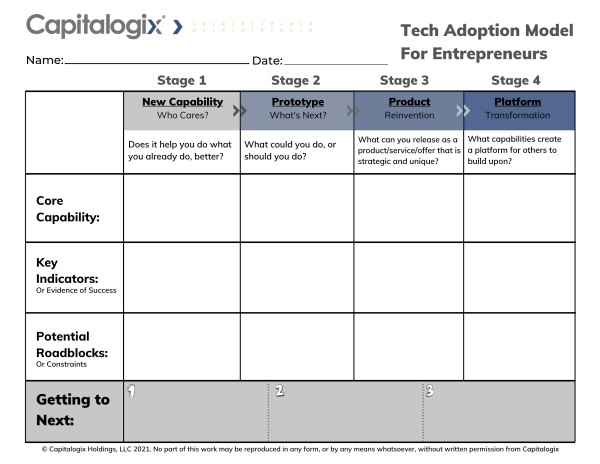
Today, I have a video and a worksheet for you that goes into the overarching Technology Adoption Model Framework. It explains how thoughts become things and how ideas scale with respect to capability, audience, and monetization.
The four base stages of this framework are: Capability –> Prototype –> Product –> Platform.
It's a great use of 20 minutes. Check it out.
While the Technology Adoption Model Framework stages are important, the ultimate takeaway is that you don't have to predict what's coming, only how human nature works in response to the capabilities in front of them.
It's a bit cliche, but to paraphrase Wayne Gretzky, you just have to skate to where you think the puck is going to be.
Desire fuels commerce. As money fuels progress, desire grows … and so does the money funding that path. As such, the path forward is relatively easy to imagine.
This isn't about predicting specific technologies, but rather about the capabilities people will want. I think of it as anticipating the natural path. It is easier to ride the wave than it is to fight nature.
Each stage is really about the opportunity to scale desire and adoption.
It isn't really about building the technology, rather it is about supporting the desire.
If you understand what is coming, you don't have to build it, but you can figure out where you want to build something that will benefit from it.
This model is fractal. It works on many levels of magnification or iteration.
What first looks like a product is later seen as a prototype for something bigger.
For example, as a Product transforms into a Platform, it becomes almost like an industry of its own. Consequently, it becomes the seed for a new set of Capabilities, Prototypes, and Products.
SpaceX's goal to get to Mars feels like their North Star right now … but once it's achieved, it becomes the foundation for new goals.
This Framework helps you validate capabilities before sinking resources into them.
In the video, I walk you through several examples of companies, their innovations, and how they fit into each stage. I even used Capitalogix as an example.
I'm also attaching a fillable PDF of the form we used so that you can run through this with your business as well.
As I continue to refine and work with this framework, I look forward to improving it and sharing it with you all.
As the world continues to change faster and more dramatically, this framework will help you anticipate changes, and it will also help you take advantage of them.
If you have any questions or comments about the idea, or how to implement it, feel free to reach out.
My mother watches the news religiously. To her credit, she watches a variety of sources and creates her own takeaways based on them. Regardless, there's a common theme in all the sources she watched – they focus on fear or shock-inducing stories with a negative bias. As you might guess, I hear it when I talk with her.
While I value being informed, I also value things that nourish or make you stronger (as opposed to things that make you weak or less hopeful).
Negativity Sells.
Sure, news sources throw in the occasional feel-good story as a pattern interrupt … but their focus skews negative. History shows that stories about improvement or the things that work simply don't grab eyeballs, attention, or ratings consistently.
The reality is that negativity sells. If everything were great all the time, people wouldn't need to buy as many products, they wouldn't need to watch the news, and this cycle wouldn't continue.
It's worth acknowledging and understanding the perils our society is facing, but it's also worth focusing on the ways humanity is expanding and improving.
As a brief respite from the unending doom and gloom of mainstream media, Information Is Beautiful has a section of their site focused on "Beautiful News".
It's a collection of simple data visualizations for positive trends, it's updated daily, and can be sorted by topic.
The law of averages is a principle that supposes most future events are likely to balance any past deviation from a presumed average.
Take, for example, flipping a coin. Should you get 5 "Heads" in a row, you'll assume the next one must be "Tails" despite the fact that each flip has a 50/50 chance of landing on either.
Even from this example, you can tell it's a flawed law. While there are reasonable mathematical uses of this law, in everyday life, this "law" mostly represents wishful thinking.
It's also one of the most common fallacies seen in gamblers and traders.
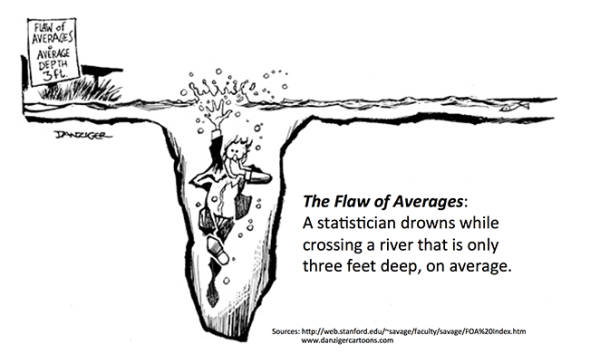
Perhaps you heard the story about how the U.S. Air Force discovered the 'flaw' of averages by creating cockpits based on very complex mathematics surrounding the average height, width, arm length, etc. of over 4,000 pilots. Despite engineering the cockpit to precise specifications, pilots crashed their planes on a too regular basis.
The reason? With the benefit of hindsight, they learned that very few of those 4,000 pilots were actually "average". Ultimately, the Air Force re-engineered the cockpit and fixed the problem.
It's a good reminder that 'facts' can lie, and assumptions and interpretations are dangerous. It's why I prefer taking decisive action on something known, rather than taking tentative actions about something guessed.
In many of my recent talks, I've been focusing on a technology adoption model for entrepreneurs. It is a framework that explains how thoughts become things and how ideas scale with respect to capability, audience, and monetization.
The four base stages are: Capability –> Prototype –> Product –> Platform.
You can listen to me talk about it in more detail on my recent podcasts, I'm also working on a separate video about this.
From a different perspective, each stage of the Framework requires the following Innovation Activity Centers.
I shot a video going into more detail. Check it out.
Understanding the Technology Adoption Framework and the Innovation Activity Centers makes it easier to understand and anticipate the capabilities, constraints, and milestones that define the path forward.
We are making lots of progress refining these models, and they are the basis for our plans to expand our Amplified Intelligence Platform.
Ultimately, frameworks aren't important if you aren't using them.
If you have questions about this, or how you might use these models, feel free to reach out to me.
In any case, there are growing reasons to be wary of Bitcoin as a viable long-term value store.
On top of the many reasons I've talked about in previous articles, I'm hearing many more people talk about it as if they are crypto experts. Consequently, it reminds me of the Dot.com bubble. Sure, the Internet continues to boom (but many of the early high-fliers don't exist today). Meanwhile, it's possible crypto will evolve like the Internet, but at this point, it's hard to discern how much of the success in crypto is luck versus skill.
There is a ton of demand and interest. But fear of missing out and enjoying the roller-coaster ride is not the basis of a long-standing Platform. Blockchain is a different story.
Back to Crypto … Even a blind squirrel finds a nut in a forest during a bull market.
Governments have a disincentive to allow alternate currencies (not backed by their government). In addition, another obstacle for cryptocurrency mining is the high cost of energy consumption.
Mining crypto takes a lot of electricity because when people are creating new coins they're really solving complex math puzzles with a 64-digit hexadecimal solution known as a hash. To solve those equations faster than your competitors you need massive data centers which can even overload local infrastructure.
It's increasingly expensive and energy-taxing to mine new coins. For context, it's estimated that the current annual power consumption for Bitcoin alone (not including other cryptocurrencies) rivaled the state of New York, and beat Norway.
To compare it to the tech giants, Bitcoin took 129 terawatt-hours of power consumption … Google took 12, and Facebook only took 5.
Many are looking for ways to decrease the energy consumption of mining cryptocurrency using methods like renewable resources.
Biden campaigned heavily on an economic plan centered around bolstering the middle class, taxing the wealthy, and investing in healthcare and green energy infrastructure. There are other aspects of his plan – but those were the focuses.
During the Robinhood & Gamestop debacle, I wrote an article about r/WallStreetBets where I essentially said that most of the retail investors that frequent the site don't know what they're doing, but there is the occasional real post with strong research you would see at a real firm.
As an example of good research done by the subreddit, here's a link to a post where a user (nobjos) analyzed 66,000+ buy and sell recommendations by financial analysts over the last 10 years to see if they had an edge. Spoiler: maybe, but only if you have sufficient AUM to justify the investment in their research.
There are also posts that show a clear misunderstanding of markets, and more jokes than quality posts, but I saw a great example of correlation ≠ causation.
In the past I've posted about the Superbowl Indicator and the Big Mac Index, but what about Oreos?
The increasingly-depraved debuts of Oreos with more stuffing indicate unstable amounts of greed and leverage in the system, serving as an immediate indicator that the makings of a market crash are in place. Conversely, when the Oreo team reduces the amount of icing in their treats, markets tend to have great bull runs until once again society demands to push the boundaries of how much stuffing is possible.
1987: Big Stuf Oreo released. Black Monday, a 20% single-day crash and a following bear market.
1991: Mini Oreo introduced. Smaller icing ratios coincide with the 1991 Japanese asset price bubble, confirming the correlation works both ways and a reduction of Oreo icing may be a potential solution to preventing a future crash.
2011: Triple Double Oreo introduced. S&P drops 21% in a 5-month bear market
2015: Oreo Thins introduced. A complete lack of icing causes an unprecedented bull run in the S&P for years
2019: The Most Stuf Oreo briefly introduced. Pulled off the shelf before any major market damage could occur.
2021: The Most Stuf Oreo reintroduced. Market response: ???
It's surprisingly good due diligence, but also clearly just meant to be funny. It resonates because we crave order and look for signs that make markets seem a little bit more predictable.
The problem with randomness is that it can appear meaningful.
Wall Street is, unfortunately, inundated with theories that attempt to predict the performance of the stock market and the economy. The only difference between this and other theories is that we openly recognize the ridiculousness of this indicator.
More people than you would hope, or guess, attempt to forecast the market based on gut, ancient wisdom, and prayers.
While hope and prayer are good things … they aren’t good trading strategies.
A good reminder that even if you do the work, if you're looking at the wrong inputs, you'll get a bad answer.