
The Bad News:
- The dollar has been very weak.
- Like the temperature in Dallas, the price of gas continues to rise.
- Housing prices, however, continue to fall to record lows. Nice summary here.
- Despite the recent rally, the average stock is still 27% beneath its 52-week high.
- And market commentators point out that we are entering a period of negative seasonality.
The Good News:
Somehow the market is finding a way to rise. It is often tough to remember, yet price is the primary indicator; and it is going up. That is a good sign, especially during periods of apparent bad news.
This was another solid week for the major Indices, with virtually every index taking out their respective downtrend-lines for the week. Barron’s called it the best finish of 2008.
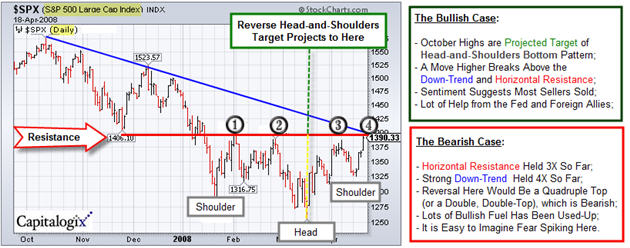
The S&P 500 finally closed above the 1400 level for the first time since early January. If it holds, that upside breakout moved the S&P 500 out of a three-month trading range into an intermediate recovery. The next major test likely will take place at its 200-day moving average and a trendline drawn over its October/December highs.
Here is a similar chart of the NASDAQ.

Please answer the poll below.


