Market Commentary

  • Conspicuous Consumption

    Billion-Dollar Home 275p
    According to the 2007 Wealth Report, there are more millionaires than ever. (WSJ).  The report also examines the growing concentration of wealth by the super-wealthy.  So, apparently, the rich are getting richer.

    As the market worries about recessions, inflation, the strength of the Dollar, and the price of oil … I noticed a strange focus on conspicuous consumption. Here are some of the articles that prompted this post:

    • Lexus LF-A supercar priced from $200,000 to $265,000 (AutoBlog)
    • Eton’s “World’s Most Expensive Shirt” costs $44,740 (Trendhunter)
    • Don’t Get Wet; Davek’s $149 Umbrella will protect you from the rain (Davek)
    • Wall Street joint serves up a $175 Burger (CBS News)
    • For $150,000 You Can Have a collection of 50 Visionaire Magazine issues. (WSJ)
    • Flushing Money Away on the Million-Dollar Bathroom (Barron’s)
    • The first Billion-Dollar Home (Forbes)
  • Dubai’s new “Shape-Shifting” skyscraper — $3,000 per square foot (CNN & Reuters)
  • Market Commentary from June 20th, 2008

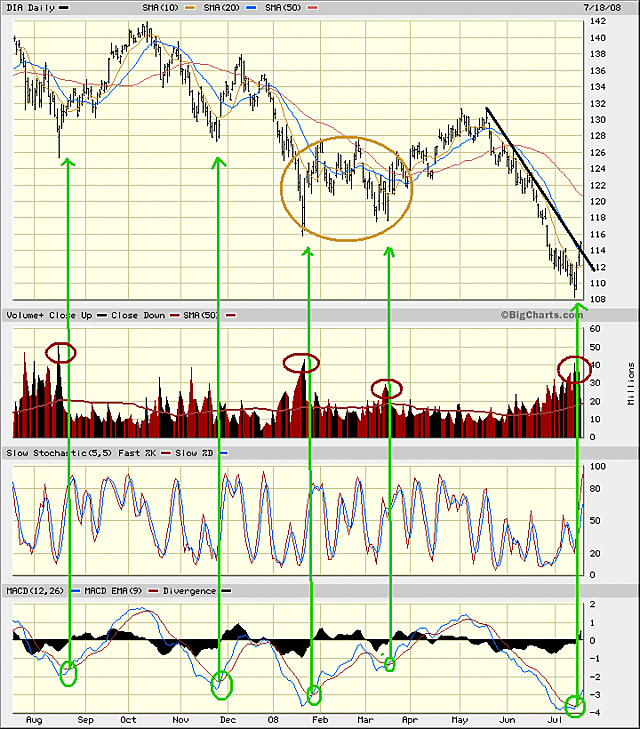
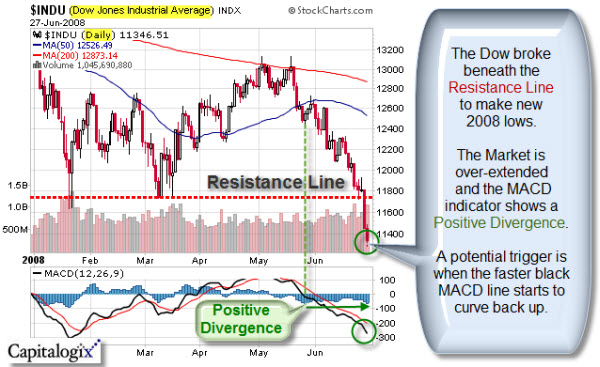
    The March lows are in sight, at least for the Dow (and the Financial Sector is already beneath that level).

    Sentiment is getting more bearish.  And, the S&P 500 is set to have its fourth consecutive quarter of negative earnings growth.   Based on history, though, the market has typically outperformed its averages after earnings have been weak for this long.

    For your reading pleasure, here are some of the items that caught my eye this week:

    • Fed sending signals that rates aren’t going higher yet. (WSJ, FT, WP)
    • AAII Bear Sentiment above 50%, for 11th time in past year. (Bespoke)
    • Royal Bank of Scotland issues crash warning for stock and credit markets. (Telegraph)
    • Ex-Bear Stearns Fund Managers Arrested. (Bloomberg)
    • Short-Selling is tough, and good for the Markets. (The Economist)
    • Is the S&P 500 Index a good benchmark to compare performance against? (Infectious Greed)
    • “The Frozen Gaze” Op-Ed Column on Tiger Wood’s Focus and Mental Toughness. (NYTimes)
    • Obama 1st major party candidate to reject public financing and its spending limits. (NYTimes)
    • IBM Roadrunner is the new world’s fastest computer. (InformationWeek)
    • Philadelphia to Fake-Out Drivers With 3D Speed Bump Images. (Gizmodo)
    • Bad guys really do get the most girls. (New Scientist)
  • How Clear is Your Market Vision, Through the Lens of Emotions?

    Do lower prices frighten people?  Or, do fearful people cause lower prices?

    On some level, it is clear that the ebbs and flows of a Market Chart represent the collective fear and greed of its participants.  As more people get fearful, you have more sellers.  As more people get greedy, prices catch a bid. 

    But what about you and me?  Are we immune from the primal portion of our brains?  As I was thinking about this, I saw the following quote:

    "The thoughts they had were the parents of the actions they did; their feelings were parents of their thoughts."

         -Thomas Carlyle (1795-1881)

    It is true, isn't it?  Thoughts flow from feelings.  Or (at least) feelings affect thoughts.  At some level, I've known this about many discrete areas of my life (motivation, relationships, etc.).  Yet I've resist accepting this as a global truth. 

    Nonetheless, it makes sense that understanding (or at least recognizing) what you feeling is an important step in better thinking and better actions. 

    Likewise, if you are a discretionary trader, it might be interesting to note how your emotions affect your trading. For example, it is pretty clear that your emotional state can create an anchor point and context that affects
    judgment and even the interpretation of market signals (for example,
    whether or not to take a trade).

    On any given day, I might get angry, happy, frustrated, excited or even
    greedy.  We all experience a range of emotions regularly, don't we?  Yet from a trader's perspective, it might feel like nothing noteworthy is happening to them throughout the day.  Why?  Because traders are so used to the range of emotions they experience, experiencing them again simply feels "normal", and  they learn to ignore them.

    As a systematic and algorithmic trader, emotions still affect my day.  That is why we follow the "rules" while the market is open.  Discussions about changing rules or adding new rules happen after-hours (when the fear and greed simmer down and heads clear).

    Clearly, many things can affect how and when a discretionary trader
    trades. Identifying and recognizing when something affects you is the
    first step towards mastering it.

  • “It’s About Time” — Or, Isn’t it?

    There is a difference between working on a problem and focusing on a solution.  Thus, trying to improve performance is different than focusing on limiting losses. 

    Einstein said: "We cannot solve our problems with the same thinking we used when we created them."

    It got me thinking. Most trading charts are time-based (meaning that price change is measured against time).  But maybe looking at price change in other ways would provide a different perspective.

     
    There are several interesting techniques gaining favor among technical traders.  These include measuring price change based on a certain volume traded or a constant range of directional movement.  Here is a link to a brief article about this in StockCharts.com.
     
    In some respects, these are "smoothing" techniques.  Nonetheless, they present a different picture of the market, and are something worth investigating.
     
    Here is how the S&P 500 Index looks like in one of these charts.
     
    080613 SPX Renko Chart
  • Market Commentary from June 13th, 2008

    Wall Street is expecting another volatile week.  In addition to our regular complement of oil price spikes, Dollar worries, inflation fears and economic reports on home building and wholesales prices … this week, the biggest news might be the quarterly earnings reports from Morgan Stanley (MS), Goldman Sachs (GS), and Lehman Brothers (LEH).

    Currently, just 33% of stocks in the S&P 500 are above their 50-day moving averages.  Much of this weakness has come from the Financial sector.  Only 17% of Financials are above their 50-day moving averages.  To see how ugly that sector has been, take a look at the charts of the Financial Sector SPDR (XLF) and the Banking Index ($BKX).  Both are back at, or near, their lows. 

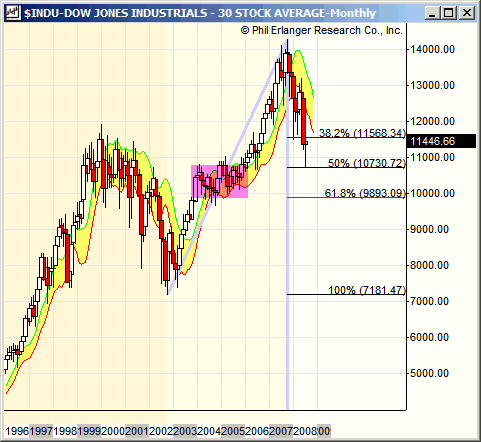
    But, next week also has Phi Day.  What?  Your friendly Fibonacci traders may note that June 18 is 6-18 (and everyone knows how important .618 is in trading).  If not, then you haven't spent time at Prechter's site.  Even if you don't believe it, enough traders watch the 61.8% retracement level, it is worth monitoring.  For example, check out the current chart on the Dow.

    080613 INDU Fib Level 600p
    Of course, not all US Equity Indices have fallen that far.  In contrast, note the relative strength of the S&P MidCap Index.

    080613 MID Relative Strength 600p

    Here are some of the things that caught my eye this week: