Market Commentary

  • Capitalogix Commentary on the Markets 12/05/08

    There was good and bad news in the market this week. The bad news was that the economy continued to suffer (for example, the worst job loss numbers in decades), and the good news was that the market went up anyway. In contrast to recent reactions, that's very good news. 

    Something about the tempo of the market may have changed this week too. There were still a few big fast moves, however there were also longer periods of more natural trading.

    I'm not saying that the bear market is over. It will probably take a lot more than this to have a meaningful long-term bottom. Nonetheless, we may have a nice intermediate term support area in place, and the possibility for a decent rally from here.

    Running robot with charts

    The Migration to Automated Trading:

    For many years I was a discretionary trader.  That means I decided what
    to buy and what to sell using the tools I thought gave me the best edge
    for that trade.  Over time I relied more on technical analysis.  And,
    now, my trading is done by automated systems. 

    The use of so many
    different algorithms provides an interesting perspective on the rhythm
    of market.

    For years, market charts reflected the collective fear and greed of market participants.  Likewise, the patterns from one generation are not much different than the patterns from a different generation of traders; not because the world hadn't changed, but because human nature hadn't changed.

    People still traded with people.  When prices got too high, a certain percentage of people decided to sell.  When prices started to go down, some people got fearful – and as prices continued to go down, other people got greedy and decide to buy.  In other words, human nature is human nature; and while the magnitude of the moves may change a little, the basic pattern, the shapes and the slopes probably have remained relatively consistent for millennia.

    The Markets Are Changing:

    Now, however, something different is beginning to happen.  A greater percentage of the daily trading volume results from computer trading and automated models.  Consequently, more trades are happening outside the influence of fear and greed.  This means that the shapes and the basic nature of trading patterns are bound to change.

    It is early in this cycle.  Think about the Internet in the early 1990s.  Looking back, it all makes sense.  Yet in 1995, did you imagine this (how radically research, media, information delivery, media, and commerce would change)?  The game is changing.  Investing will never be the same again.

  • Capitalogix Commentary on the Markets 11/28/08

    Will Consumers Be Naughty or Nice This Holiday Season?  There was a lot of commentary on the start of holiday season sales this week.  The WSJ notes that bargain-hunters turned out in force for the "Black Friday" pre-dawn store openings and sales, but the annual frenzy was tempered by cautious buying amid the economic downturn. American consumers say they are less interested in consuming than at any other time in the past four decades. Still, the tone has been cautiously optimistic, so far, with the belief that more shopping is will shift online, even though online sales for the first three weeks of November are down 4% from last year.  In a related article, the NYTimes suggests that TV sales are becoming the litmus test for U.S. economy, and offers a glimpse of the
    broader tensions between cautious consumers and desperate retailers.

    Still, the Market has gained 21% since its low made five trading days ago (when the S&P 500 hit a new low for this bear market and touched levels last seen in 1997).  Many attribute this week's rally to some significant Government actions, such as:

    The Most Volatile Market Ever.

    According to Bespoke, over the last 50 trading days, the average absolute daily percentage change of the S&P 500 has been 3.82%!  That means the S&P 500 is averaging a daily move of up or down nearly 4%.  This is definitely one of the craziest (yet most telling) statistics of the current bear market, and unfortunately, the majority of the daily moves have been down.  In the history of the S&P 500, there has never been a more volatile period.  The closest other period was in the early 1930s.  In contrast, back in February of last year, the 50-day average absolute change was just 0.33%.  Here is a chart that illustrates the spike in volatility.

    SP500 Volatility Highest Ever

    What about Sentiment?  Well, the CBOE Volatility Index (VIX) has moved beneath its 50-day moving average for the first time in almost three months. Given the inverse relationship between the VIX and stocks, some read this as a bullish sign.

    SentimenTrader's Smart-Dumb Money indicator.  The Markets may still have some room to downside.  Yet, in contrast to the bearish bets made by small traders, recent Commitments of Traders reports (and other indicators) show that large commercial hedgers (aka the "Smart Money") are quite bullish. 

    081124 Sentimentrader Smart-Dumb Money Index

    Historically, a confidence spread this wide only happens once or twice a year.  Nonetheless, this is the fourth time we had such a sentiment spread this year.  In practice, the Confidence Indexes rarely get below 30% or above 70%.  Usually, they stay between 40% and 60%.  When they move outside of those bands, it's time to pay attention. The chart above shows that substantial bullish reversals often happen when this occurs.

    What Does This Say About the Spirit of Our Times?  This may not be market commentary but it might show the zeitgeist of the business climate.  McDonald’s wants to patent how it makes a hot sandwich.  I guess that is the other side of the coin from when McDonald's got sued by someone who got burned when they spilled a 49-cent cup of coffee in their own lap.

  • Capitalogix Commentary on the Markets 11/21/08

    The market is weak right now.  How do I know?  Aside from the near-audible moan of the world's collective unconscious, price going down is a pretty good primary indicator.  Kidding aside, other indicators are worth looking at here too.  One of them is the NYSE High-Low line. 

    The following chart shows this market breadth indicator.  It is calculated at
    the end of each day by taking the number of NYSE stocks making New 52-week
    Highs and subtracting the number of stocks making New
    52-week Lows. What is important to notice is the shape of the line – up is strong (or
    bullish), down is weak (or bearish).  Sometimes a picture is worth a
    thousand words. 

    081119 NYSE New Highs - New Lows

    You can view updated versions of this chart anytime on StockCharts.com at this link.

    Advice For the Markets: Stop It!

    So, what should the markets do next?  At this point, humor seems appropriate. I saw this clip of Bob Newhart from Mad TV, last week, and it made me laugh.

    Sometimes laughter is the best medicine.

  • Weekly Commentary through November 15th, 2008

    This was a big week for questions (and not so much for answers).  The Market is good at that.

    For example, did we just witness another successful retest of recent market lows, or are we just at the bottom again? 

    Are you surprised that GM's share price is at lows not seen since 1943?  If not, were you surprised they wanted in on the Bail-out too?  How surprised were you that the Bail-out isn't proceeding as planned?  Do you wonder whether Depression Economics is returning? 

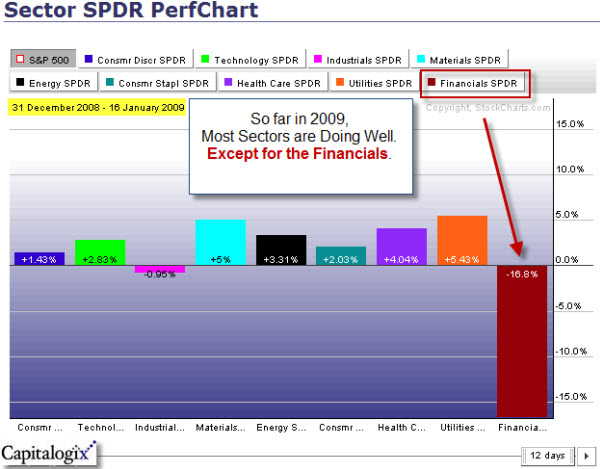
    Many people believe that the finance sector is an early indicator for the market in general. This was a tough week for finance sector stocks. Yet, many stocks in that sector made spike bottoms.  This is something I am watching.

    Still, volatility remains high, and I take that as a sign of bear markets.  In the chart below, which shows the S&P 500 Index, the green line represents the index itself; and the red line shows the daily percent change in that Index, illustrating how volatility has increased recently.

    081115 SP500 Volatility High

    (via Investment Postcards)

    The Cloud Hanging Over the Markets:

    People look for scapegoats During market troughs.  One of the first places they are looking now is the hedge fund industry.  What follows is a Wordle "word cloud" created from the text of the Congressional hearings held last week.

    Hedge fund congressional hearings -text cloud

    I loaded the text of the hearings to the site; so, Click this link to play with this Word Cloud.

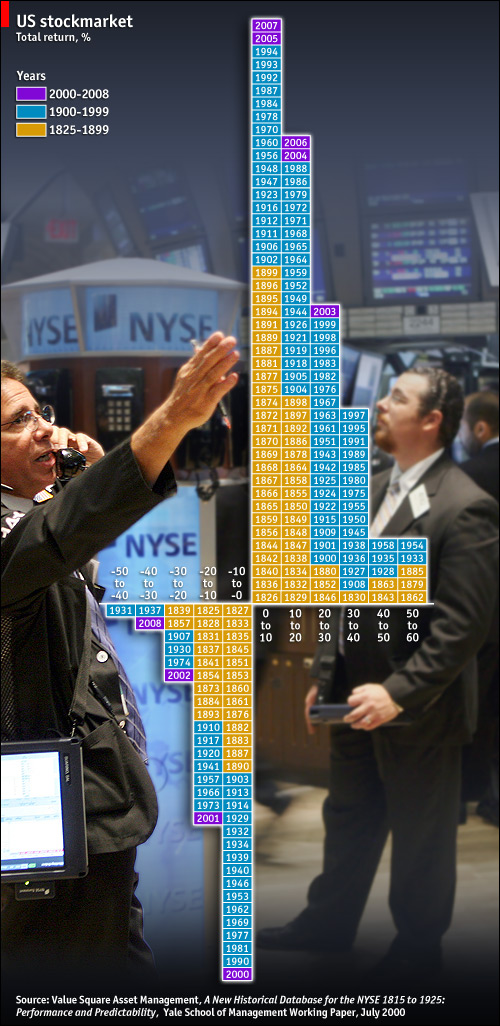
    Ultimately, the markets are having a tough time world-wide.  If you are standing in the rain, you are going to get wet.  Well, it rained a lot this year.  Take a look at this chart that shows the distribution of yearly returns in the US.  Hint: look at the bottom left of the graphic to find this year.Return Distribution from Canaccord 600p

    (hat-tip to Howard Lindzon)

    With markets performing so poorly here, and world-wide, It is not surprising that the demand for gold is rising in China or Saudi Arabia.

  • Weekly Commentary through November 7th, 2008

    Who (Or What) Really Controls the Markets? 

    Watching the 500-point down day following Obama's election,
    it would be easy to attribute the move to a reaction to the vote.  However,
    virtually every market
    around the globe suffered the same fate.

    When I first started trading I used to say things like, "I wonder what
    they're going to do in the morning?"  Or, "Wow, they are really trying
    to mess with people."  The point is that I anthropomorphized the market.  In
    other words, I made the Market seem like a person or a group of people
    with consciousness and intent.   

    It's easy to imagine a
    secretive group controlling things behind the scenes.  Maybe it's a
    select committee from the top investment banks.  And of course, you've
    heard of the "Plunge Protection Team", who supposedly steps in from
    time-to-time, "pressing buttons" and causing markets to dance their
    dance.

    As appealing as it is to believe that there's so much
    order and control underneath our markets, the fact that there's been so
    much correlation around the world, both to the downside and the upside,
    tells me that what is more likely in control is the fear and greed of
    the market's collective participants.

    Why is There So Much Fear? 

    Goldman Sachs forecast
    the deepest U.S. recession since the Reagan era after the unemployment
    rate climbed to the highest level in 14 years and payrolls tumbled for
    a 10th consecutive month. Ultimately, the economy has lost 1.2 million
    jobs since December, with over half of those losses in the last three
    months as the problems from the recession accelerate.

    On a related note, according to the WSJ, Goldman Sachs is approaching the share price it went public close to a decade ago. 

    081107 Japan at 26 Year Low
    While US equities market has been down recently, international markets had it worse. The fact that China just announced a 4 trillion Yuan ($586 billion) stimulus package — equivalent to nearly one-fifth of 2007 GDP
    — underlines how nervous Beijing is at the speed of its economic
    slowdown.

    And in Japan, the Nikkei hit a 26-year low a week ago (click to view chart). Forget about the lost decade, in Japan it has been the lost quarter century.

    The
    Nikkei has lost more than 20% of its value in the last month and is
    down by more than 40% for the year, capped by a 9.6% one-day loss a
    week ago. That put it lower than it was back in October 1982. 

    Yes,
    they have yo-yos in Japan too.  The Nikkei rallied 33% in 6 days this
    week, only to tank again.  As you can see, it is a small world.