Goldman Sachs announced massive profits of almost $3.5 Billion this Quarter. On one hand that is great. On the other, does it make you wonder where and how they made that money?
On a related note, Bespoke notes that, in the first half of the year, Goldman set-aside over $11 Billion to compensate its employees. Nice work if you can get it.
The Stimulus Plan.
The economy, and the mood about the economy, seem to be doing a little better. I give credit for the effort. Though, I am watching spending and employment numbers to tell me more of the story.

Some Market Charts.
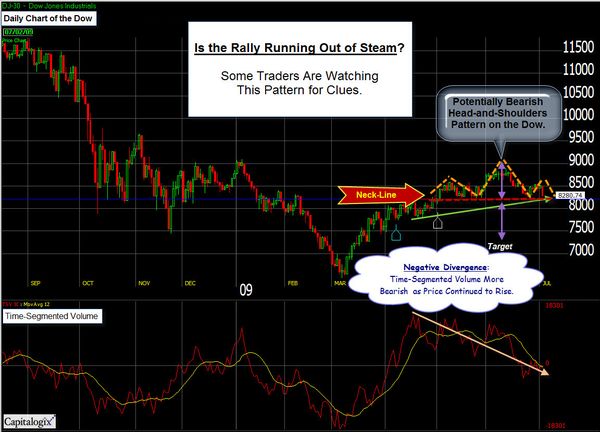
For the past few weeks, many people have been watching the potential head and shoulders pattern. Its failure to trigger caused many people to cover their short positions. This was probably the primary catalyst for the “Oops” trade that took the market back near its recent highs.

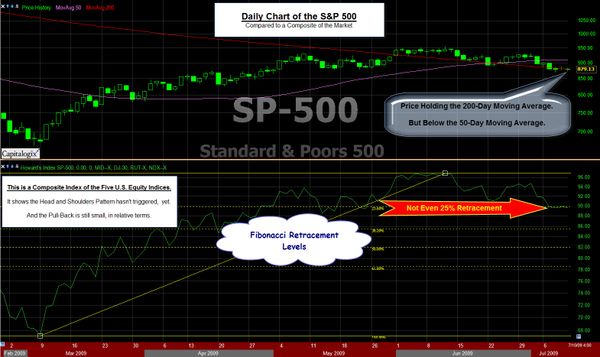
Those recent highs are interesting to me for several reasons. First, they’ve held since early June. Second, and potentially more importantly, they may be part of a much bigger pattern forming on the major U.S. equity indices.
Here is a picture of the S&P 500 Index. Notice the potential inverse head and shoulders bottom pattern (marked in orange). If it triggers (shown by the green neckline of resistance), and if it hits the measured target (shown by the purple arrows), then it is certainly worth watching. Of course, that is a lot of “ifs”.

Some Things to Watch.
So, the upside is clear, take out the June highs and see if we get some buying volume. However, I can’t get excited, yet. There are a number of things holding back my enthusiasm. Right off the top-of-my-head: jobs, spending, lack of volume, and the failure to trade above recent highs.
However, another thing I’m watching is that recent moves up in the market were met with an increase in the VIX (instead of the expected inverse relationship). Here is a picture from Marty Chenard’s chart service called StockTiming.com.

Recently, it bothered me that the VIX failed to show a spike of fear when the market was going down. And now, the VIX is bothering me because it’s going up when the market goes up. So, either this is not a good time to follow the VIX for trading guidance, or the VIX is indicating that something unusual is happening in the markets. Either way, it makes me cautious. What about you?
While I expected a short-term rally, I still believe that the markets are due for an intermediate-term move downwards. However, neither logic, intuition, nor economics are primary indicators. Price is the primary indicator; and it has been moving upwards.
Business Posts Moving the Markets that I Found Interesting This Week:
- Wall Street 2015: Has It Changed Forever? (Forbes)
- Goldman Had Huge Profits – Why are Executives Selling? (Dealbook)
- Intel Gives Upbeat Outlook as Sales Revive. (WSJ)
- Dell Shares Dive as PC Market Still Looks Rough. (Technology Review)
- McGraw-Hill’s Seeking a Buyer for BusinessWeek. (WSJ)
- Ways Apple Is Extending Its Lead Via 3rd-Party iPhone Apps. (WSJ)
- Help Is On the Way for Credit-Starved Small Businesses. (Forbes)
- More Posts Moving the Markets.
Lighter Ideas and Fun Links that I Found Interesting This Week
- If The Jetsons Had Email, What Would it Look Like? (MediaPost)
- Building a Biologically Accurate Artificial Brain. (WSJ)
- Why Some People Sneeze When the Sun Comes Out? (New Scientist)
- Even the Homeless Use Facebook to Stay Wired. (WSJ)
- Can Companies Profit By Giving Away Digital Products & Services? (NYTimes)
- Microsoft Office 2010 Preview in Pictures (eWeek)
- Get Your Wisdom: Well Done Summaries of Big Ideas. (Philosopher’s Notes)
- More Posts with Lighter Ideas and Fun Links.