Market Commentary

  • Capitalogix Commentary 07/19/09

    Goldman_Sachs_logoGoldman Sachs announced massive profits of almost $3.5 Billion this Quarter.  On one hand that is great.  On the other, does it make you wonder where and how they made that money

    On a related note, Bespoke notes that, in the first half of the year, Goldman set-aside over $11 Billion to compensate its employees.  Nice work if you can get it.

    The Stimulus Plan.

    The economy, and the mood about the economy, seem to be doing a little better. I give credit for the effort.  Though, I am watching spending and employment numbers to tell me more of the story.

    090719 Stimulus Cartoon - Stimulator 3000

    Some Market Charts.

    For the past few weeks, many people have been watching the potential head and shoulders pattern. Its failure to trigger caused many people to cover their short positions. This was probably the primary catalyst for the “Oops” trade that took the market back near its recent highs.

    090719 SP500 OOPs Trade

    Those recent highs are interesting to me for several reasons. First, they’ve held since early June. Second, and potentially more importantly, they may be part of a much bigger pattern forming on the major U.S. equity indices. 

    Here is a picture of the S&P 500 Index. Notice the potential inverse head and shoulders bottom pattern (marked in orange).  If it triggers (shown by the green neckline of resistance), and if it hits the measured target (shown by the purple arrows), then it is certainly worth watching.  Of course, that is a lot of “ifs”.

    090719 SP500 BottomingTrade

    Some Things to Watch.

    So, the upside is clear, take out the June highs and see if we get some buying volume. However, I can’t get excited, yet.  There are a number of things holding back my enthusiasm. Right off the top-of-my-head: jobs, spending, lack of volume, and the failure to trade above recent highs.

    However, another thing I’m watching is that recent moves up in the market were met with an increase in the VIX (instead of the expected inverse relationship).  Here is a picture from Marty Chenard’s chart service called StockTiming.com.

    090719 SP500 VIX Behavior

    Recently, it bothered me that the VIX failed to show a spike of fear when the market was going down. And now, the VIX is bothering me because it’s going up when the market goes up. So, either this is not a good time to follow the VIX for trading guidance, or the VIX is indicating that something unusual is happening in the markets.  Either way, it makes me cautious.  What about you?

    While I expected a short-term rally, I still believe that the markets are due for an intermediate-term move downwards. However, neither logic, intuition, nor economics are primary indicators. Price is the primary indicator; and it has been moving upwards.

    Business Posts Moving the Markets that I Found Interesting This Week:

    • Wall Street 2015: Has It Changed Forever? (Forbes)
    • Goldman Had Huge Profits – Why are Executives Selling? (Dealbook)
    • Intel Gives Upbeat Outlook as Sales Revive. (WSJ)
    • Dell Shares Dive as PC Market Still Looks Rough. (Technology Review)
    • McGraw-Hill’s Seeking a Buyer for BusinessWeek. (WSJ)
    • Ways Apple Is Extending Its Lead Via 3rd-Party iPhone Apps. (WSJ)
    • Help Is On the Way for Credit-Starved Small Businesses. (Forbes)
    • More Posts Moving the Markets.

    Lighter Ideas and Fun Links that I Found Interesting This Week

  • Capitalogix Commentary 07/12/09

    Obama told the G8 that the "World has Staved Off Economic Disaster." So, it's all good now.  You are safe to jump back in the pool.  If there was still risk, he couldn't have said that in front of world leaders, right?

    Is This the New Normal … Or Just the Calm Before the Storm?

    Here is a chart that shows how volatility has reduced recently.  Putting on my curmudgeon hat for a moment, I remember the old trader's adage that lack of volatility begets volatility.

    090711 Volatility is Down

    That chart whispers "beware the calm before the storm" to me.  Others may see a return to normal.  What do you think?

    A Look At the Markets.

    The markets have given back close to 25% of their recent gains in the last four weeks. In many respects that was a healthy move. The news has been bad enough that I expected a bigger and steeper downswing.

    Also, there's been a lot of talk about the potential of a head and shoulders top. But when you look at a composite of the five U.S. Equity Indices (shown in the bottom-half of the chart, below), we haven't broken the neckline, yet.

    In addition, the 200-day moving average (red line) continues to provide support. If we don't have a sustained break beneath this level, the 200-day moving average will act as support.  Click the chart to see a full-size image.

    090711 SP500 and Composite

    With that said, sentiment is getting more bearish, and the move down
    has not created a spike in the VIX. So, again, there are clues that lead me to suspect that we might be witnessing the calm
    before the storm.  Earnings Season is starting; and a move down would trigger the head-and-shoulders topping pattern and the 200-day moving average would become overhead resistance.  And fear would increase … you get the picture.

    Sometimes, the right picture can be worth a thousand words.

    Dow's Dead-Cat Bounce from GuidePostings

    So short-term, a bounce wouldn't surprise me. Nonetheless, a bigger correction still seems likely.

    Business Posts Moving the Markets that I Found Interesting This Week:

    • Businessman Pays $2.1 million for Lunch with Buffet; Banks More (DigitalJournal)
    • 11 Places With a Worse Economy Than Ours. (USNews)
    • Currency Funds Crushed on Dearth of Market Trends. (Bloomberg)
    • The Dollar's role in the global economy is Safe From the Yuan, for Now (WSJ)
    • Ex-Goldman Sachs Employee Arrested Stealing Secret Trading Codes. (StreetInsider)
    • Citadel Sues Firm Linked to Alleged Goldman Software Theft. (FinAlternatives)
    • Mark Cuban on Business Models: Succeed with Free, Die by Free. (BlogMaverick)
    • More Posts Moving the Markets.

    Lighter Ideas and Fun Links that I Found Interesting This Week

  • Capitalogix Commentary 07/05/09

    Another grim report on unemployment casts doubt on the likelihood of a quick economic recovery. 

    The unemployment rate edged up to 9.5 percent in June, to its highest level in 26 years. The bigger problem is that many analysts expect joblessness to get worse in the coming months.

    A Different Perspective on the Job Market:

    Here is a chart that caught my eye on Barry Ritholtz's blog.  It shows the increased competition for jobs.  There are now close to six unemployed people for each available position.

    090705 Unemployed Per Job-Opening Chart

    The point is that as fewer jobs become available, it will get harder for normal citizens to obtain them.  The cycle continues because loss of jobs means reduced spending … which means tighter margins. 

    So, this next chart doesn't surprise me.  It shows that in addition to an increase in unemployment, there was also a decrease in hours worked.  Simply counting the number of people who lost their jobs misses something important. Lots of people have lost part of their jobs through a variety of techniques like furloughs and thirty-hour work weeks.

    090705 Not Just Fewer Jobs - Less Hours Worked

    Notice how consistent the decline in aggregate hours worked (purple line) has been over recent months. It is something to watch.

    For a longer perspective, here is a chart comparing the monthly national unemployment rates since 1948.  Click the chart to see the interactive version on WSJ.com.

    090705 Unemployment Since 1948

    Market Chart:

    How will all that play-out in the Markets?  So far, the markets have held-up nicely.  I've been seeing more negative divergences and selling on down days … and less positive momentum and market breadth. But price is the primary indicator, and it has stayed above support.

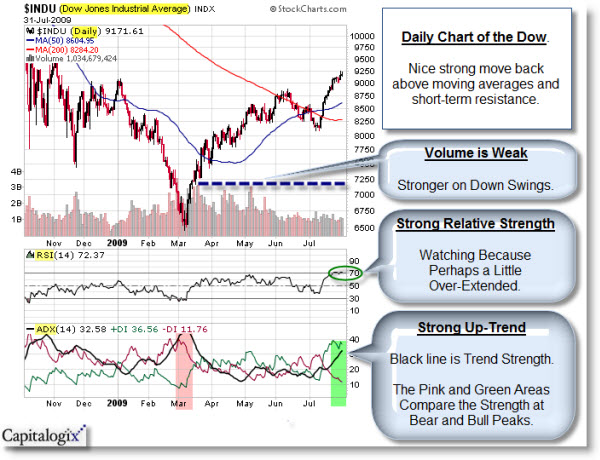
    Here is a daily chart of the Dow Jones Industrial Average Index.  I marked a head and shoulders pattern that many traders are watching.  Click the chart to see a full-size image.

    090705 Head and Shoulders Pattern on Dow Daily

    Short-term, a bounce still wouldn't surprise me. Nonetheless, a bigger correction seems likely.

    Business Posts Moving the Markets that I Found Interesting This Week:

    • Investors are Now Racing Toward Volatile Areas of the Market. (NYTimes)
    • Another Indicator Predicts Economic Recovery is Near. What do you think? (MJPerry)
    • A China Stock Bubble: IPO Mania Dangerous in Recession. (Time and Economist)
    • Why China Hates the U.S. and What It Means for Your Portfolio. (Motley Fool)
    • A Run on an Amish Bank Teaches the Risks of Modernity. (WSJ)
    • The Fed's Delicate Balancing Act On the Complex & Slow Road to Recovery. (SmartMoney)
    • How GE Reaped Bailout Dollars Even Though It Wasn't a Bank. (TDB)
    • More Posts Moving the Markets.

    Lighter Ideas and Fun Links that I Found Interesting This Week

    • Michael Jackson Insider on What Really Killed Him. (TDB)
    • Monkey 'Stock Market' Prone to Fluctuations Too. (NewScientist)
    • Calculating Consumer Happiness at Any Price. (NYTimes)
    • A Glimpse at the Future: Domestic Robots With A Taste For Flesh. (NewScientist)
    • Scientists Create First Electronic Quantum Processor. (PhysOrg)
    • Tomato Pill's new form of Lycopene Beats Heart Disease. (BBC)

    • Is an Ugly Baby Harder to Love? (Time)
    • More Posts with Lighter Ideas and Fun Links.
  • Capitalogix Commentary 06/28/09

    Rolling Stone is not where I typically read insightful Market commentary.  Nonetheless, Matt Taibbi wrote a piece for them you should read.  The article is called "The Great American Bubble Machine", and it details Goldman Sachs' role in engineering every major market manipulation since the Great Depression.  Take a look.

    0906028 Goldman Sachs Bubble Machine Article Link

    Also, here is a link to the text of the article.

    Other Asset Classes.

    This chart caught my eye.  It shows the top-ten residential real-estate markets, and let's just say none of them are around here.  Click the picture to go to Reiden's site for more data.

    0906028 Most Expensive Real Estate 

    I guess Goldman Sachs isn't the only one who can create Bubbles. 

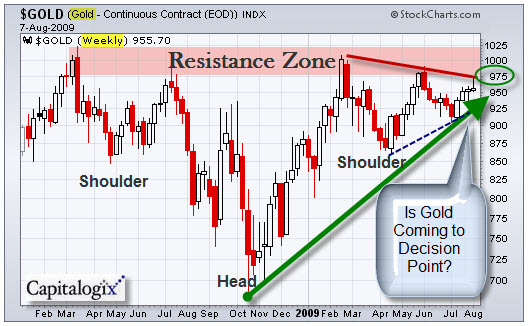
    Also, I'm hearing a lot more rumblings from experienced traders about buying a little gold.  Richard Russell, of Dow Theory fame, says: “The way the world is going, ‘gold will be the last man standing’. Gold will be wanted because unlike everything else, gold can not go bankrupt. Gold has no debt against it, gold is not the product of some nation’s central bank. Gold is pure intrinsic wealth. It needs no nation to guarantee it. Gold is outside the paper system.”

    Confidence In the U.S. Equity Markets.

    The VIX closed at 25.93 today, down more than 16% from Monday’s close of 31.17 to the lowest closing level since September 12, 2008 – the last trading day before the Lehman Brothers bankruptcy was announced.  A rise in volatility from these levels would likely be bearish.

    0906028 VIX At Recent Lows

    Bespoke notes that the Michigan Confidence joins the growing number of indicators that are now at or better than Pre-Lehman levels.  It is currently at its highest level since January 2008.  This month's reading is also the fourth consecutive month-over-month increase in confidence.  

    Market Metaphor?

    This NYC hotel claims that one of its rooms is not only a tourist attraction, but is “art”. Art that starts to smell bad in warm weather.

    Business Posts Moving the Markets that I Found Interesting This Week:

    • Why Isn't The Stimulus Stimulating? Seems Like Speed Will Matter. (Forbes)
    • World Economy Tracking or Doing Worse than the Great Depression. (VoxEU)
    • Morgan Stanley Topples Goldman as M&A Leader this Year. (NYPost)
    • List of Banks with the Biggest Profits and Losses Last Year. (Economist)
    • Tech Sector Strength May Be Weaker than Claimed. (Barrons)
    • Why Computers Can't – Yet – Consistently Beat the Market. (Forbes)
    • Michael Jakson's Debt, Private Equity & His Hedge Fund Backer. (FinAlternatives)
    • More Posts Moving the Markets.

    Lighter Ideas and Fun Links that I Found Interesting This Week

    • What Is Your Favorite Michael Jackson Song? Interactive Retrospective. (NYTimes)
    • Windows 7 at Half Price: Why is Microsoft Offering Discounts? (InformationWeek)
    • New Defense Industry Niche: Researchers Developing Tiny Flying Spies. (Forbes)
    • New Book on the Secret History of the National Security Agency. (USNews)
    • Super-Intelligence: When Will Computers Be Smarter Than Us? (Forbes)
    • Google Voice: Smarter Phone Calls for Your Smart Phones. (NewScientist)
    • Can You Get Fit in Six Minutes a Week? The Research is Promising. (NYTimes)
    • More Posts with Lighter Ideas and Fun Links.
  • Capitalogix Commentary 06/21/09

    Time flies when you are having fun.  We're almost halfway through the year, and the markets have rallied now for three-plus months. That sounds positive … So why are so many people focused on the  Federal Reserve's two-day meeting that ends Wednesday?  My guess is that many investors will be watching for any changes in the long-term economic outlook.

    So we are at a Tipping Point, once again.  There is cash on the sidelines waiting for a sign that it's safe to get back in the game; and there are investors who are looking to protect their rally profits, or are afraid of the next leg down.

    This daily chart of the Dow Jones Industrial Average Index highlights what bulls and bears see.  We'll soon know which is more committed.

    090621 Dow Analysis 600p

    From my perspective, I understand why discretionary traders might want to try to buy this pull-back.  There is a clear Risk-Reward; and it's easy to set your stop.  However, experience warns me to be wary of set-ups like this where market breadth is weakening.  My wife doesn't like charts that have too many marks on them … she says they are confusing.  So I tried to find a different image that conveys what this chart may be whispering to the little bird.

    I Feel Good

    Finally, I was reading Paul Kedrosky's blog when I ran across this chart showing the price of crude oil from 1861 through 2208.  It comes from BP.  It provides an interesting perspective.

    090621 Crude Oil Prices Since 1861

    Business Posts Moving the Markets that I Found Interesting This Week:

    Lighter Ideas and Fun Links that I Found Interesting This Week

  • Capitalogix Commentary 05/14/09

    Swine Flu Symptoms

    The Swine Flu made headlines again.  Apparently, no one cares that the the U.N.'s World Health Organization officially declared the outbreak to be a "pandemic" this week.  If you don't know what to look for,  this picture illustrates some symptoms.

    If the Markets' continued rally is taken as evidence, then it also appears that people don't care about the threats weighing down the economy.  The Major U.S. Index Averages are holding above their 200-Day declining moving averages and overhead resistance.  Also, Bespoke notes that eighty-four percent of the stocks in the S&P 500 are trading above their 50-day moving averages.  With that said, momentum is waning … three months into the rally. 

    Of course, the length and staying power of the rally says something about how crowds work, and why the majority of traders are often wrong at turning points in the market.  The following video makes the same point, a different way.  On the surface, it starts with a lone male, dancing at a music festival.  It is fascinating to watch what happens when other people feel the urge to get in on the fun. It takes about one-minute for people to start joining in.  By two-minutes, there's a crowd.  And by three, it's a mob.

    Here is the direct link to the video on YouTube.  This says something about human nature, doesn't it?

    Business Posts Moving the Markets that I Found Interesting This Week:

    Lighter Ideas and Fun Links that I Found Interesting This Week

    • The Top Twelve Funny Indicators That The Economy Is Bad. (Big Picture)
    • Why Microsoft Windows 7 XP Mode is a Major Advancement. (eWeek)
    • Making Fat Disappear with a Genetic Strategy from Bacteria. (Tech Review)
    • When Sleep Leaves You Tired: It's the Quality, Not Quantity. (WSJ)
    • When a 'Chosen' Tibetan Lama Says "No Thanks". (Time)
    • How Twitter Will Change the Way We Live. (Time)
    • More Posts with Lighter Ideas and Fun Links.