Bernanke said that the recession is "most likely over"; but added that the recovery would be jobless.

Moreover, recent surveys show that many companies expect to shed jobs
in the next 12 months and do not expect to reach former staffing levels
before 2012. The question is: How will that affect the economy and the markets?
Are They Buying or Selling the News?
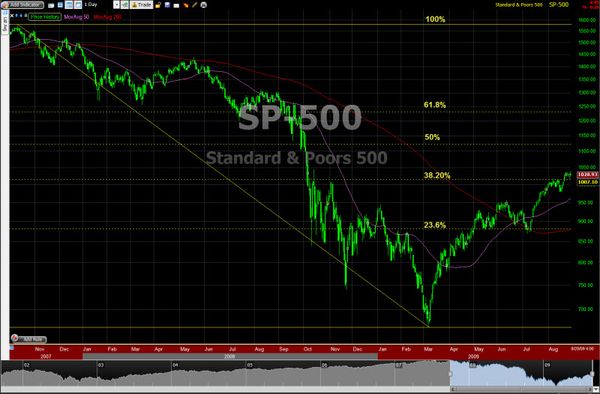
I'm paying attention to indications that the markets have begun selling-off after news. This is typical behavior near tops and during bearish swings. In contrast, during the recent rally, the Markets often went up despite bad news.
There Still Is Not Much Selling Pressure.
From a technical and market psychology perspective, we are seeing short spikes of intra-day selling that have not had much follow-through. However, it seems to me that fewer people are buying the dips and a bunch of negative divergences are in place. All that means is that it is time to watch major trend lines; they will tell you when something changes.
Is Something Fishy Churning Just Beneath the Surface of Our Markets?
Several articles claim that up to 40% of the volume in the New York Stock Exchange, recently, occurred in just four financial stocks: Bank of America, Citigroup, Fannie Mae, and Freddie Mac.
It could be normal, or at least something simple and innocent. Nonetheless, I am suspicious and a little skeptical that such a small group of low-priced stocks could account for such an unusual percent of the trading volume on the NYSE. Realistically, I doubt that it was retail investors jumping-in to drive the rally higher.
So was it churning, high-frequency flash trading, or a tacit government
sanctioned way to allow certain funds and brokers to profit while
making the markets appear healthier than they are? I don't know; but it has started people talking. And it is something that will stay on my radar.
The Changing Face of the Giants of Finance.
On a related topic, the NYTimes had a great interactive graphic showing how the Giants of Finance have changed. Since the stock market’s peak in October 2007, Wall Street’s landscape has been permanently altered. Lehman Brothers, gone. Bear Stearns, gone. Merrill Lynch, gone. Main Street’s landscape has also changed. Wachovia, National City, Washington Mutual and Countrywide, all gone. These financial giants all crumbled under the weight of the financial crisis.
Those that were left shrank down to a fraction of their former market capitalizations by early 2009, but since then, they all have grown. While most are nowhere near their former size, two — JPMorgan Chase and Wells Fargo — are slightly larger than they were at the market’s peak. Click the image to play.

Let me know what you think. Hope you have a great week.
Business Posts Moving the Markets that I Found Interesting This Week:
- Retail Hopes Running Ahead of Reality. (WSJ)
- As Biggest Banks Repay Bailout Money, the U.S. Sees a Profit. (NYTimes)
- Foreign-Account Holders May Face Double Trouble Treasury & IRS.(InvestNews)
- Wall Street’s Math Wizards Forgot a Few Variables. (NYTimes)
- Econophysicist Predicts Date of Chinese Stock Market Collapse. (TechReview)
- More Posts Moving the Markets.
Lighter Ideas and Fun Links that I Found Interesting This Week
- What Do Dogs See, Smell, and Know? (NYTimes)
- How to Profit from Uncertainty While Limiting Your Risk. (Wharton)
- SmartPhoniacs – Addicts of the Information Age. (WSJ)
- The No-Junk Business iPhone Apps Finder for Business. (InfoWorld)
- Why Don't More Apps Take Advantage of Multi-Core Chips? (Forbes)
- More Posts with Lighter Ideas and Fun Links.