
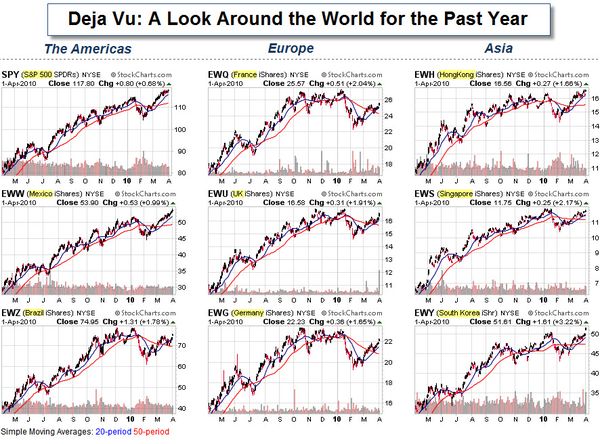
The Dow Jones Industrial Average traded above 11,000 for the first time since 2008. The real question is whether that is a sign of continued strength or that the rally has climbed too far, too fast?
Smart Money – Dumb
Money Confidence Index.
The chart, below, compares the bets made by small traders (a.k.a. the "Dumb
Money"), to those of large commercial hedgers (a.k.a. the "Smart
Money").
In practice, Confidence Index readings rarely get below
30% or above 70% (they usually stay between 40% and 60%). When they
move outside of those bands, it's time to pay attention.
Even
more noteworthy is when there is a wide confidence spread with bullish bets by the Dumb Money and bearish bets by the Smart Money. This type of
sentiment
spread only happens a few times a year. We
often get substantial bullish reversals when that happens.

Conventional trading wisdom says that Crowds are
usually wrong at turning-points. That doesn't mean they are wrong all
the time (yet I take special notice when the Smart Money clearly disagrees).
Consumer Credit Woes Adding Fuel to the Doubt Fires.
Here is a chart from BusinessInsider showing the Fed's latest consumer credit reading. After starting to recover, total outstanding consumer credit had a massive month-over-month decline.

It is tough to stage a lasting recovery without consumers.
So Where Is the Money Coming From?
U.S. Federal debt has increased rapidly.

In a related chart, Doug Short created an
inflation-adjusted view of the debt and an overlay of the tax brackets. With the 2001 and 2003 tax cuts expiring this year, the question is whether the gross
federal debt will be a factor in determining the direction of future tax
rates? Perhaps, like a young household with good jobs buying a home, the
US can afford the rising level of debt? What do you think?
Speaking of Debt-Laden Countries.
European governments on Sunday offered debt-laden Greece a rescue package worth as much as 45 billion euros ($61 billion) at below-market interest rates as they try to end Greece's fiscal crisis and restore confidence in the euro.

Business Posts Moving the
Markets that I Found Interesting This Week:
- Double Dip Watch: Brown Shoots? (Yelnick)
- Geithner Speaks: No End to U.S. Housing Handouts. (WSJ)
- Lehman Chief Warns of More Big Bank Failures. (CreditWritedowns)
- Speculators: The Early Warning System for Markets. (NYTimes)
- Seabreeze's Kass on U.S. stocks: 'I Have Been Wrong'. (Reuters)
- More Posts
Moving the Markets.
Lighter Ideas and
Fun Links
that I Found Interesting This Week
- Math Genius Turns Down $1M Prize For Solving Proof Problem. (Newser)
- Why Starbucks' Pricing Challenges Are About to Get Worse?
(Minyanville) - The Caffeine Debate Continues. (TonyHorton)
- Has Viral Gone Viral? Chatroulette has 1M daily visitors, in just 3
months. (NYTimes) - Game of Death: French TV Shocks with Torture Experiment. (Time)
- More
Posts with Lighter Ideas and Fun Links.
![Reblog this post [with Zemanta]](http://img.zemanta.com/reblog_c.png?x-id=7db38659-beb8-4b87-a5ae-518dad450b81)
 It brings up two questions:
 With consumers mostly out of the market, institutions figured-out how to buy and sell from each other, making relatively easy profits with minimal risk.
![Reblog this post [with Zemanta]](http://img.zemanta.com/reblog_c.png?x-id=62e82373-7ee2-427f-8389-bae872622dc9)


![Reblog this post [with Zemanta]](http://img.zemanta.com/reblog_c.png?x-id=548afa6e-fc1f-471b-840e-9aaf4d28f9f3)


![Reblog this post [with Zemanta]](http://img.zemanta.com/reblog_c.png?x-id=2a510835-2afd-456c-8621-305859fb21a7)


![Reblog this post [with Zemanta]](http://img.zemanta.com/reblog_e.png?x-id=423cd613-8cb8-4eb0-a0d0-df9fd1b47c3d)