

The Dow Jones Industrial Average broke below 10,000 last week. Then again, it also crossed right back above that level. If it seems like 10,000 has been one of the most 'magnetic' 1,000 point thresholds, you are right. On the other hand, is it a meaningful trading level?
All-in-all, May was quite a month! We saw a "flash crash", followed by a 400-point
relief rally, followed by a slow motion free-fall, followed by a nearly
300-point rally. The cherry-on-the-top was last Friday's triple-digit
drop going into the long weekend.
Putting the Dow's Drops and Rebounds in Perspective.
The market's recent "flash-crash" ranks as the largest point-wise drop in history. But how does it stand up percentage-wise; and how many drops greater than 5% have we seen? Minyanville posted a visualization of the data (going back to 1928) that answers those questions. Click to the graphic for an interactive version.

One other point worth noting, historically, big gaps and daily rallies occurred most often in the context of bear markets. They are not usually a sign of impending calm waters or smooth sailing.
Nonetheless, we've seen a decent pull-back and there are signs that the short-term might offer some upside bias.
Recently, Bearish Spikes Have Provoked Bullish Responses.
Bespoke reports that this week's sentiment surveys from Investors Intelligence and
the American Association of Individual Investors showed
sharp increases in bearish sentiment among both advisors and individual
investors. The chart below compares the S&P 500 with bearish sentiment since the
start of 2009. The current level of combined bearish sentiment is the
highest since the start of November. As shown in the chart, since the
market bottomed back in 2009, spikes in bearish sentiment have actually
turned out to be pretty good buying opportunities.

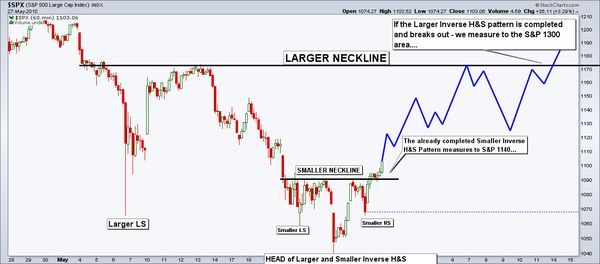
So, let's look at the market. Short-term, here is David Singer's
bullish case for the S&P. It is drawn on a 60-minute chart, and shows a series of head and shoulder bottom patterns. The implication is for a rally that measures the same distance as from the neckline to the head.
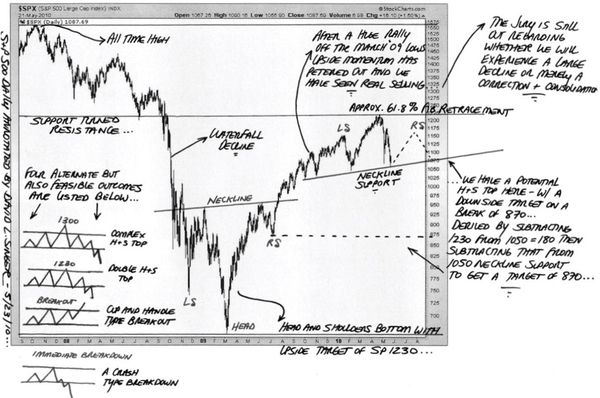
Longer-term, Singer shows a potential head and shoulders topping pattern on a daily view of the S&P 500. Click it to see a
larger version.
We'll see. Hope you have a good week.
Business Posts Moving the
Markets that I Found Interesting This Week:
- Lehman Sues JPMorgan for Billions in Siphoning Damages. (Wall_St_&_Tech)
- Wall Street's War: 2,000 Lobbyists versus Financial Reform. (Taibbi)
- S.E.C. Proposes Circuit Breakers for S&P 500 Stocks. (NYTimes)
- Apple Overtakes Microsoft as Most Valuable Tech Company. (NYTimes)
- How Steve Jobs Blew $10.3 Billion on "The Dumbest Trade Ever". (Insider)
- More Posts
Moving the Markets.
Lighter Ideas and
Fun Links
that I Found Interesting This Week
- Bloomberg's List of the Top 50 New Business Books. (Bloomberg)
- How Group Dynamics May Be Killing Innovation. (Knowledge@Wharton)
- iPhone 3GS Price Slashed; 4G Next? (InformationWeek)
- Adventures in Eating: Committing Hara-Kiri by Hamburger. (LATimes)
- Scientists Create ‘Artificial Life’ with Synthetic Living Cells. (TDB)
- More
Posts with Lighter Ideas and Fun Links.
![Reblog this post [with Zemanta]](http://img.zemanta.com/reblog_c.png?x-id=cc58c2bc-ee7f-427f-9a1d-5579a0ae3dad)


![Reblog this post [with Zemanta]](http://img.zemanta.com/reblog_c.png?x-id=5036bf7d-9b96-4a7e-8c3f-6375a3439d3c)


![Reblog this post [with Zemanta]](http://img.zemanta.com/reblog_c.png?x-id=0ee19bab-7540-4b0b-b5a7-986e40cb1018)


![Reblog this post [with Zemanta]](http://img.zemanta.com/reblog_c.png?x-id=5e97204e-e26c-47ac-bf0d-b9d75a987cb4)

![Reblog this post [with Zemanta]](http://img.zemanta.com/reblog_c.png?x-id=67a164aa-e5a6-4196-b874-96eb8e8a0c06)