The Q3 2010 IntraLinks Deal Flow Indicator™ (DFI) was just released and reports a 38 percent increase in global M&A deal activity in Q3 2010 versus Q3 2009. In the last quarter, deal activity is up nine percent compared to Q2 2010, a 68 percent increase from the Q1 2009 low.
Results show six straight quarters of growth in M&A deal volume, with a 68 percent increase from Q1 2009
The overall positive trends are consistent with the following factors in the marketplace:
General improvement and stability in the market
Impending tax environment changes and stockpiles of committed capital have provided the return of private equity buyers and sellers
Reduced strategic buyer fear of “double dip” recession resulting in more exploration of opportunities to supplement slow organic growth prospects and enter new markets.
Bernanke Outlines 'Case for Further Action' to Spur Economy Forward.
Fed ChairBen Bernanke has some ideas about pumping more money into the flagging recovery to get us out of a different kind of hole. In talks last week, he clearly presents the case for more action.
He predicts a weak recovery and continued high unemployment.
Bernanke talks about a mandate-consistent 2% inflation rate — further emphasizing this idea that the Fed will aggressively target positive inflation.
Barry Ritholz posted a word cloud of the speech. It speaks for itself.
According to the WSJ, the Fed sent an even clearer message in its written remarks. How? Bernanke used italics only four times in the report. Do those four instances constitute a 'font of wisdom' message from the Fed chairman. Let's look at the message.
First, Mr. Bernanke said the Fed takes its cues from two primary objectives: the "longer-run sustainable rate of unemployment" and the "mandate-consistent inflation rate." He later made clear what the Fed thinks about both right now: Inflation is "too low" and unemployment "too high."
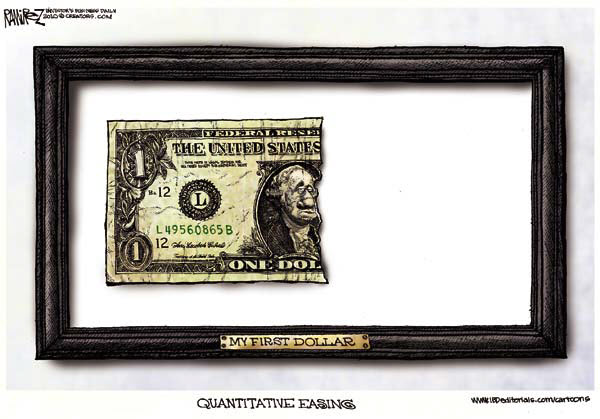
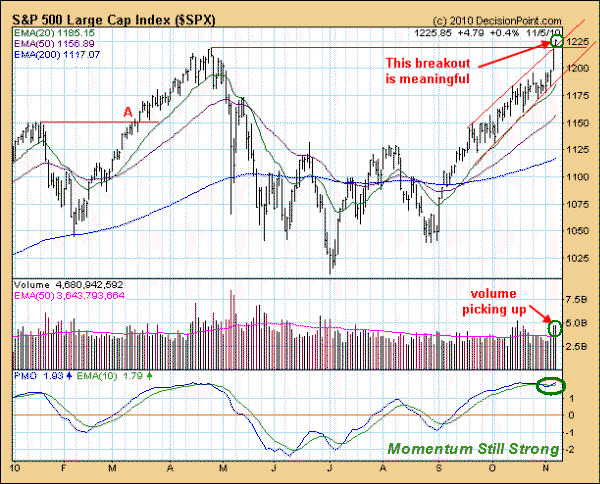
That makes further Quantitative Easing pretty much a given, to the relief of investors who have already priced it in with a 12% surge in the S&P 500 since late August.
However, some commentators (like David Rosenberg) are skeptical about how much of the gain is priced-in already. His message: Sell the news, Quantitative Easing will do more harm than good.
Market Commentary
Even though stocks are overextended after a seven week run, I have not yet seen compelling evidence of weakness that would signal the start of a correction or pullback.
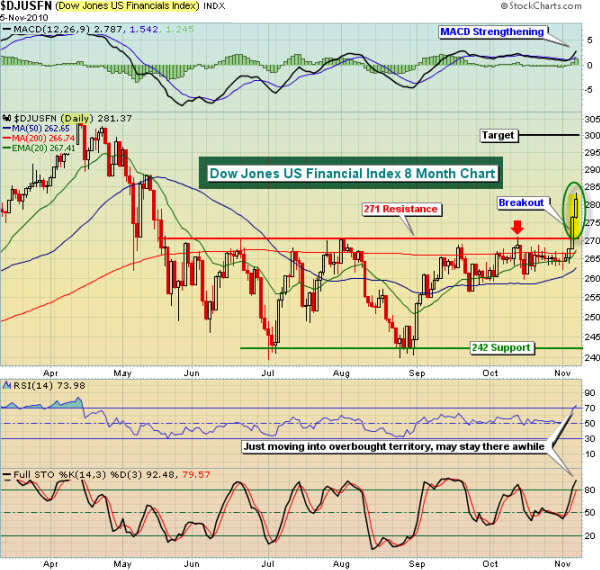
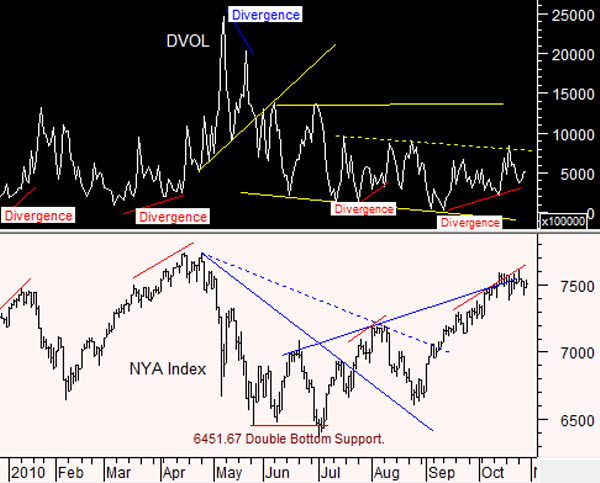
Nonetheless, I'm watching a few things closely. For example, we are seeing some negative divergences in the banking and financial sectors. They have not enjoyed the same success as the rest of the market over the last several weeks, and this may be telling us something.
On the other hand, the Nasdaq 100 Index (comprised of the large capitalization tech stocks) is leading the move higher. The recent strength in this index not only made a new 52-week high last week, it also hit levels not seen since late 2007. Should the S&P 500 Index follow this leader, the short-term future looks good.
The Economist's Big Mac index seeks to make exchange-rate theory more digestible. They say it is arguably the world's most accurate financial indicator to be based on a fast-food item.
The Big Mac index is based on the theory of purchasing-power parity (PPP), according to which exchange rates should adjust to equalize the price of a basket of goods and services around the world. For them, the basket is a burger … a McDonald’s Big Mac.
According to this measure, the most undervalued currency is the Chinese yuan, at 40% below its PPP rate. In China, a McDonald’s Big Mac costs just 14.5 yuan on average, the equivalent of $2.18 at market exchange rates. In America, the same burger averages $3.71.
The tensions caused by currency misalignments prompted Brazil’s finance minister to complain last month that his country was a potential casualty of a “currency war”. The Swiss, who avoid most wars, are in the thick of this one. Their franc is the most expensive currency on our list.
The table below shows by how much, in Big Mac PPP terms, selected currencies were over- or undervalued.
The index is supposed to give a guide to the direction in which currencies should, in theory, head in the long run. It is only a rough guide, because its price reflects non-tradable elements such as rent and labor. For that reason, it is probably least rough when comparing countries at roughly the same stage of development.
Which Currencies Are Beating-Up On the Dollar?
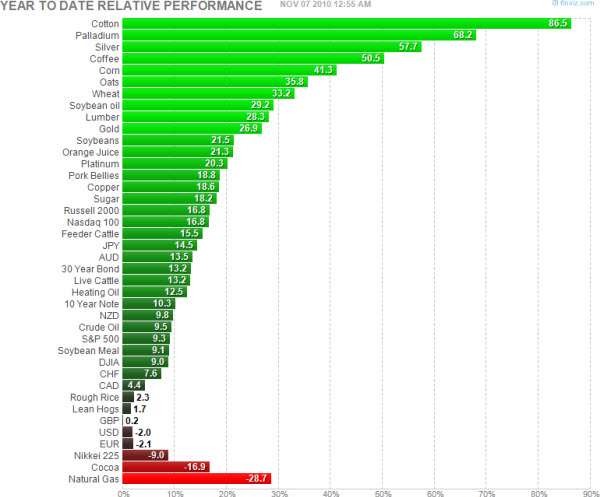
You know the dollar has been in freefall since the middle of the summer. BusinessInsider posted a chart, from Morgan Stanley, showing which currencies have appreciated the most since then.
The big winner? The Swedish Krona. Note that the much-hyped yen is just in the middle of the pack.
The markets continue higher despite concerns about the economy. Remember, the markets do not reflect what is happening in the economy (nor are they supposed to). Markets reflect the expectations and speculations about the markets themselves.
There is a lot of money sitting on the sidelines, and if we don't get selling pressure — then it doesn't take much to push things higher.
The S&P 500 Has Risen Back to Its Down-Trend Line.
The bigger picture shows that the S&P 500 Index has rallied back up to the trend-line from its 2007 highs. Bulls will likely feel more confident if price can stay above this level.
How high can it go? This is a likely area for Bears to try to sell. Not only are we at overhead resistance, but the market is getting overbought.
How Can You Measure Whether the Market Is Overbought?
More than 88% of all stocks traded on the NYSE are above their 50-day moving average. We have seen similar levels three times in 2010, all resulted in large sell-offs.
The push higher will continue until sellers get more bold.
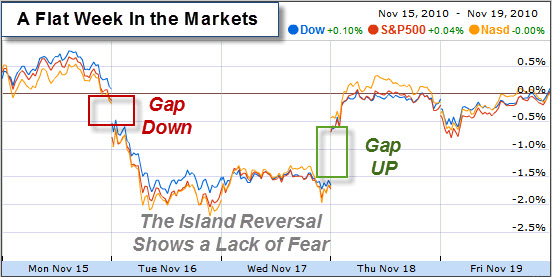
The market followed it's well-orchestrated script last week. After finally pushing above the key resistance level, there was a pause, as we waited for buyers to jump in and rally things higher. However, the market saw little real buying, and prices drifted back down to re-test the 1020 support level. When the sellers didn't jump at the opportunity, it was time for another gap higher. And that is exactly what we got.
What Does Wall Street Sentiment Show?
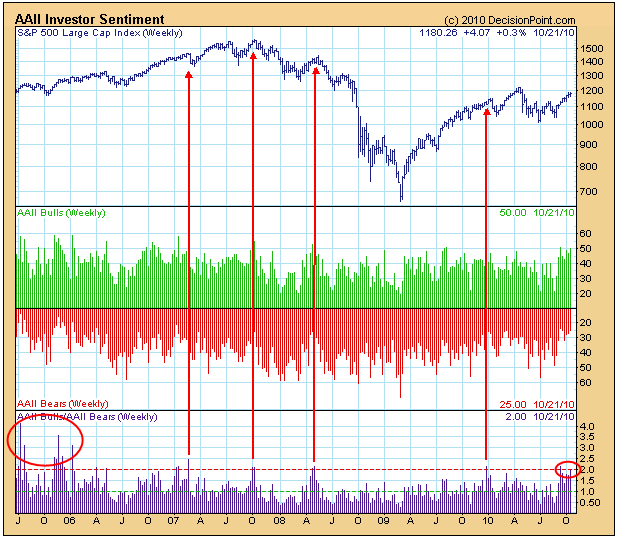
The weekly Wall Street Sentiment Survey is unique because the poll is taken after the close on Friday, and those polled are asked only to predict where the market will close as of the end of the following week — up, down, or neutral (no opinion). In other words, everyone is on the same page, and only short-term projections are solicited.
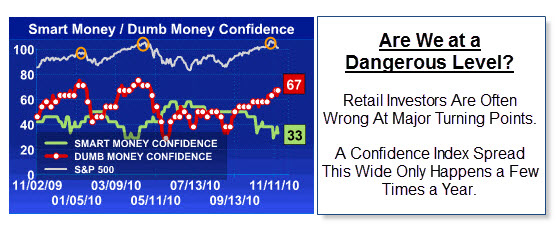
Carl Swenlin notes that bearish readings of greater than 65% often precede price tops by a week or two. Reliability seems to be enhanced if a high percentage of bears occurs during an advance.
The most recent reading of 75% bears has occurred during a modest advance, so it is probably a good idea to curb bullish enthusiasm.
Earlier this week, the National Bureau of Economic Research (the official arbiter of recession dates) declared that the recession that began in December 2007, ended in June 2009.
For some perspective on the recession just past (a.k.a. the "Great Recession"), Chart of the Day illustrates the duration of all US recessions since 1900. There are a couple points of interest. Of the 22 recessions that occurred over the past 110 years, the most recent recession is tied for fifth in terms of duration. It is also worth noting that the recession just passed was above average in duration and the longest since the Great Depression.
Well, now that the Great Recession is over, the rest should be easy … right?
What About the Economy – How Did It Do in the Third Quarter?
Clearly, unemployment and housing are two issues that need to improve to kickstart the economy. Moreover, economic growth in the second quarter slowed to an anemic 1.6% from 5.0% in the December quarter, and 3.7% in the first quarter.
Because of this, the Fed has now signaled next round of Quantitative Easing, which likely will send the U.S. Dollar and bond yields to new lows, while sending stock and commodity prices materially higher.
Do You Care if the Market Moves Because of Intervention?
From my perspective, it doesn't matter that intervention is taking the place of the invisible hand and free-market pricing. From a traders perspectives, price is price. And, as I've discussed before, it also makes sense from a practical standpoint. If intervention is the policy, then it is best for it to happen during periods of slow market activity (because it's easier and cheaper to accomplish with less resistance).
Nonetheless, it's also interesting to note how little organic buying and selling is happening in the equity markets. If you remove the moves made by (or on behalf of) governments, the trading required by ETF's or indexes, and the volume that simply comes from program trading or high-frequency trading … there's really not a lot of interest in the equity market right now.
In contrast, however, asset classes like gold and bonds are seeing a lot of interest.
But, if you are looking for something positive, remember that the "powers that be" officially declared the recession over.