Market Commentary

  • Capitalogix Commentary 11/08/10 – Don’t Fight the Fed

    The Markets are at recovery highs.

    Traders should remember this important phrase: "Don't Fight the Fed".  It applies here.

    Think of Bernanke as the manager of the world's largest long-only fund.  Further, imagine that his goal was to push prices higher.  By the way, you don't have to imagine; he said so.  To make sure you get the point, he even announced $600 billion of purchases to be made in the next 8-months – that's $75 billion a month.  Regardless of whether you think it will work (or if it will be good for the market or the economy), when money is being pumped into the system at this rate, it is difficult to bet against stocks.

    In addition, the market tends to do well after the mid-term elections, and going along with that, the 3rd year of a president’s term is historically the strongest.

    With all that, it shouldn't surprise you that the stock market continued its bullish ways as investors seemed to applaud the election results, the Fed's second round of quantitative easing, and a decent jobs report.

    Let's Look At Some Charts.

    The S&P 500 Index broke out above the April high and closed at its highest level in two years. The breakout is significant – if it can hold. Double tops can produce strong pullbacks, but if the breakout holds, the rallies tend to do well. At point “A” below you can see that breakout in March of this year went on to several more weeks of positive gains until the peak in April.


    101107 SP500 BreakOut

     An Influential Market Sector Is Perking Up.

    Many traders believe the financial sector is the most influential group in terms of leading the market.  Financials underperformed miserably in 2007 and 2008 and overall market performance followed suit.  In 2009, financials outperformed and the market recovered a lot of its prior losses. So, where are they now?

    The financials broke above key resistance. The Dow Jones US Financial Index finally broke above its key resistance level (marked by the red horizontal line at 271).  With Bernanke's announcement of increased liquidity, as if on cue, the financials led on a relative basis last week and pulled the major indices higher with it.  That 271 level now becomes excellent support.


    101107 DJ Financial Index

    Until the bears can tear down support on the financials at that level, it seems pretty solidly bullish.  Expect some of the money that rotates out of other sectors to find a home in financials.  That should spell solid outperformance in the near-term.

    What is Really Out-Performing Year-To-Date?

    The following chart illustrates the dominance of commodities so far this year. Check the numbers on the following YTD graphic from Finviz .


    101106 Commodities  Year-to-Date
    Puts things in perspective, and makes me think about inflation.

    Business Posts Moving the Markets that I Found Interesting This Week:

    • How to Profit From the Fed's New Moves. (WSJ)
    • Investors Betting on Inflation are Doing Strange Things to the Bond Market. (Slate)
    • Quantitative Easing Is Unloved & Unappreciated – But It Is Working. (Economist)
    • Bloomberg's road to the White House. (TheWeek)
    • Verizon's CEO Opens Up About Steve Jobs and Negotiating with Apple. (BizInsider)
    • More Posts Moving the Markets.

    Lighter Ideas and Fun Links that I Found Interesting This Week

    Enhanced by Zemanta

  • An Angry America Gets What it Deserves (in pictures)

    They say a country gets the politicians it deserves or perhaps it deserves the politicians it gets.

    Rather than write a commentary on the politics of an angry electorate, I'll let pictures do the talking.

    Here is the cover from this week's Economist.

    101107 Economist Cover - Angry America

    Here is a chart from the NYTimes showing the historic shift away from Democrats.

    101107 NYTimes Midterm Election Results

    Here is a political cartoon showing the pendulum swinging.

    101107 Pendulum Swings - Cole

    And here is a faux Sesame Street reminder of why it is important to play nicely with the other children.

    101107 Obama and Bert

    Enhanced by Zemanta

  • Capitalogix Commentary 11/01/10 – The Psychology of an Angry Electorate

    Next week will tell us a lot about where this market is headed. Three big events will give us a sense of how the market reacts to news from its perch near recent highs.

    It starts Tuesday, when we get election results. Many believe the market has been waiting for republicans to gain seats. If that takes place, and appears that it will, the market, you would think, will like it. However, some wonder if the news is already priced in to the markets.  Here is a chart from Intrade showing how likely people believe it is that republicans gain seats.

    101030 Intrade US MidTerm Elections Market
    On Wednesday, the fed will disclose more about QE2. The market wants to know where Fed Chair Bernanke stands on the critical issue of flooding liquidity. Again, even if the market gets what it wants, will it matter … or has the rally already priced-in the effects of QE2?
    Finally, Friday is when we see what's going on in the world of job creation (or lack thereof). This report is potentially more important than the first two, and I'm interested in how the markets respond more than I care about the details of the report.

    The Rally Continues.

    The Dow Jones Industrial Average is sitting in a decision zone with overhead resistance from the April recovery highs. This is notable because we are overbought, with negative divergences … yet almost no selling pressure. 

    101031 Decision Zone for the Dow

    A sustained move above the resistance zone, shown in pink, would be a bullish sign. 

    Down Volume Is Rising … And That Means So Is Risk.

    Have you looked at what the New York Stock Exchange's "Down Volume" (DVOL) is showing lately? Marty Chenard, from StockTiming.com did and here is what he found.

    Normal behavior in a rally is for the Down Volume to be trending lower.  

    That means, that as the market goes higher, less selling is occurring.   However, rallies always reach a point where profits start to be captured.   Since investors cannot take profits without selling, the Down Volume increases as profit taking activity increases.

    Such a Down Volume-to-Market relationship pattern can be seen on today's chart.

    101031 Down Volume Increasing
    Notice the rising red lines on the DVOL part of the chart.   Those lines show that the Down Volume was increasing as the NYA Index continued to rise.    That represented a negative divergence, and sign that investors were taking profits and selling into the rally.

    If you look at the first three instances this year, the market soon pulled back after each round of profit taking.

    What about the fourth instance?

    That is one of those "you are here now" events.    Since early September, our DVOL model shows that it has made a higher/low and a higher/high.    That is important because that is the definition of an "up trend".  

    A historical word of caution … if the Down Volume on the New York Stock Exchange index is rising, then risk levels are also rising. 

    Sentiment Is Approaching Extreme Levels.

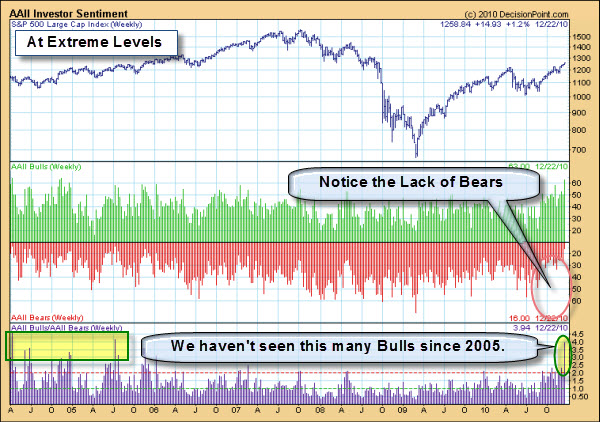
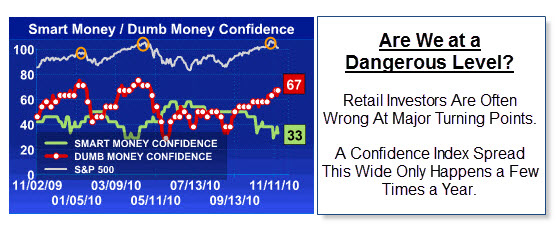
    The AAII Sentiment Survey shows a jump to a 2-to-1 ratio of Bulls-to-Bears.  Readings above 2 tend to be bearish.   We saw a reading like this about a month and a half ago and the market rally continued.  Nonetheless, if you go back to the 2007-2008 bear market, it was a good early indicator of when to be a seller.  Of course, some believe this is a bull market, so the indicator may behave differently.  The circled area shows this ratio went much higher during more bullish times in 2005 and early 2006. Still, this bears watching.
                             101031 Bulls and Bears

    Business Posts Moving the Markets that I Found Interesting This Week:

    • Goldman Sachs Admits "The Economy Is Not the Market & QE2 Is Not a Panacea". (ZeroHedge)
    • Dangerous Economic Misconceptions and a Game Show Mentality. (EconoTwist)
    • Paulson Justifies 'Terrible' Choices That Saved the Country from Economic Ruin. (OnWallSt)
    • Arguing About Money – What is a Currency War, and How Do You Win One? (Slate)
    • Hot Mutual Funds Are Often Great Contrary Indicators. (SmartMoney)
    • More Posts Moving the Markets.

    Lighter Ideas and Fun Links that I Found Interesting This Week

    Enhanced by Zemanta

  • Fed Treasury Holdings Set to Surpass China – Is That a Contest We Want to Win?

    According to Bloomberg,the Federal Reserve and Japanese investors are poised to pass China and become America’s largest creditors following efforts from U.S. policy makers and the Bank of Japan to stimulate growth.

    This chart shows the U.S. central bank’s Treasury holdings have risen to a record $821.2 billion, approaching China’s $846.7 billion. The figure for Japan is $821 billion, the most ever. China overtook both the Fed and Japan in 2008 as the communist nation bought dollars to hold down the yuan as a way to aid exporters, funneling the greenbacks into U.S. debt.

    101023 Fed About to Become America's Largest Creditor

    Does it seem strange to you that we are about to be our own biggest creditor?

    Perhaps, as a sovereign nation, it makes sense if you plan on printing money to pay it back.

    Economics Doesn't Always Make Sense.

    101024 Economist Bum Cartoon - Schorr

    Enhanced by Zemanta

  • Capitalogix Commentary 10/25/10 – Don’t Fight the Fed

    Barry Ritholz had a great quote this week.

    "If your job is to identify opportunities and risks in the market, you have to recognize that when the Fed is pouring fuel on the fire, when they send their minions out to discuss the Greenspan put, some people rush for the fire hoses … but my job is to go grab some marshmallows and sticks and head over to the Boy Scout jamboree campfire.  If your job is a policy analyst, well that’s a different situation. But if you’re an asset manager, you can’t fight the tape constantly. You have to recognize when massive Federal Reserve liquidity is going to goose the market. But I’m not going to argue with people who say this ends badly. Hey, every bull market eventually ends badly. You know, I can’t tell you if it’s a 25% correction or down 1,000 [points]. But you know what? You’ll have plenty of time to make that decision. Right now, as long as they are giving us an opportunity to make some hay, you have to participate while the sun is shining."

    Dow Stalls With High Volume Near April High.

    With a surge from 10,000 to 11,200, the Dow Jones Industrial Average is trading near its April highs and close to a 52-week high. However, it has started to stall with high volume. The chart shows the Dow battling the 11100 area with above average volume the last seven days. Arthur Hill notes that the trend since late August is still up.  Nonetheless, a high volume stall could give way to a short-term reversal that starts a correction. High volume is often present at or near inflection points.


    101024 Turning Points Often Marked By Big Volume
    The yellow areas on the chart show volume surges that occurred at turning points.

    For now, the Dow has yet to show any signs of weakness on the price chart. The Average established support at 10,900 with two lows over the last few weeks. This support level looks similar to the April support level. Notice how the April support break provided a clear signal. The bulls are in good shape as long as current support holds. A move below 10900 would argue for a correction that would be expected to retrace a portion of the prior advance.

    Are there any other clues we can watch?

    How Does the Dollar Affect the Dow?

    Looking at the charts below, it is easy to see that there is a strong inverse correlation between the U.S. Dollar and the Dow. According to TSP Talk, this is not always the case … but when it is, it does assist us to predict direction changes.

    101024 Dow and the Dollar
    The upcoming quantitative easing (QE2) by the Fed could be seen as a catalyst for the dollar's decline, as more money being pumped into the system means a weaker dollar. If QE2 is priced-in to the market already, then we could have a “buy the news” reaction in the dollar, which in turn would likely hurt the stock market.  In the mean time, the trend is clear.

    Business Posts Moving the Markets that I Found Interesting This Week:

    Lighter Ideas and Fun Links that I Found Interesting This Week

    • Sun Tzu: The Best Leadership Teacher Of All Time?  (Forbes)
    • Coffee May Combat High Blood Pressure. (WebMD)
    • 10 Most Expensive Zip Codes: Monocles & Top-Hats Not Included. (Advisor)
    • Should You Nap at Work If You Really Need One?  (Newser)
    • Obama Booked to Appear on Jon Stewart's 'Daily Show' & Mythbusters. (EW)
    • More Posts with Lighter Ideas and Fun Links.
    Enhanced by Zemanta

  • Global M&A Deal Activity Has Increased 38 Percent This Year

    101018 Deal-Flow-Indicator The Q3 2010 IntraLinks Deal Flow Indicator™ (DFI) was just released and reports a 38 percent increase in global M&A deal activity in Q3 2010 versus Q3 2009. In the last quarter, deal activity is up nine percent compared to Q2 2010, a 68 percent increase from the Q1 2009 low.

    Results show six straight quarters of growth in M&A deal volume, with a 68 percent increase from Q1 2009

    The overall positive trends are consistent with the following factors in the marketplace:

    • General improvement and stability in the market
    • Impending tax environment changes and stockpiles of committed capital have provided the return of private equity buyers and sellers
    • Reduced strategic buyer fear of “double dip” recession resulting in more exploration of opportunities to supplement slow organic growth prospects and enter new markets.

    Here is a chart.

    101018 Deal-Flow-Indicator Chart
    Read the Q3 2010 IntraLinks Deal Flow Indicator at www.intralinks.com/dealflow.

    Enhanced by Zemanta