Market Commentary

  • Here a Few Links for Your Weekend Reading

    These are a few of the links that caught my eye.

    Business Posts Moving the Markets that I Found Interesting This Week:

    • De-Bunking Economic Facts: The Crisis Suggests a Staggering Lack of Knowledge. (BW)
    • Doug Kass' Still Timely Contrarian Reminder. (TheStreet & Minyanville)
    • Starbucks CEO, Howard Schultz, Says "The Commodity Rally Is Fake". (PragCap
    • Number-Crunchers Crunched: Uses & Abuses of Models. (Economist)
    • BRIC Wall: Is China's GDP Growth-Per-Head About to Slow Down? (Economist & FT)
    • More Posts Moving the Markets.

    Lighter Ideas and Fun Links that I Found Interesting This Week

  • Using the Inflation Rate as a Trading Filter

    Wouldn't it be great if a simple number told you whether it was safe to bet on the market going higher?

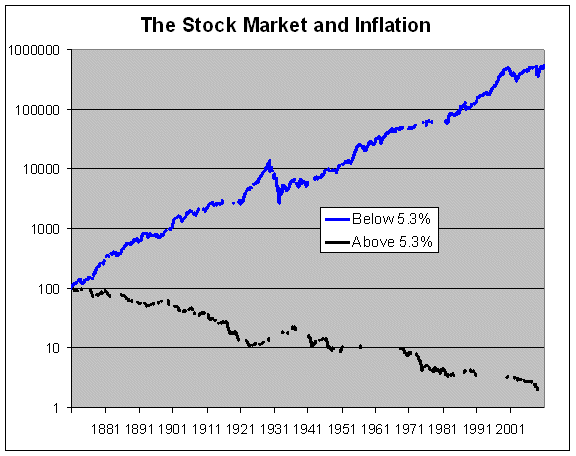
    Crossing Wall Street posted a chart that suggests the stock market does very well when the monthly inflation rate is under an annualized rate of 5.3%.  Conversely, the market has done poorly in months when inflation is above that 5.3% annualized level.  The chart shows the the monthly return above and below that level of inflation.

    110522 Stock Market Returns and Inflation
    The data goes back to 1871; and it is surprising how well this relationship has held up over 140 years. During this period, monthly inflation has been above the 5.3% annualized level about one-third of the time.

    Historically, when inflation was below 5.3%, the stock market has had an annualized after-inflation gain of 9.59%. And when inflation was above 5.3%, then the stock market has had an annualized loss of 8.15%.
     
    Did Inflation Cause Returns to Change?
     
    Computers are great at finding the optimal point for a system to trade based on historical data.  Technical traders call this "curve-fitting", and have learned to be wary of coincident variables being confused as causal variables.  That is a fancy way of saying that the relationship between inflation levels and stock market returns might be a great way to "describe" what happened; however, it doesn't prove that the inflation level "caused" the returns to go up or down. It also doesn't prove that inflation didn't cause the returns.
     
    Nonetheless, 140 years is a long time sample … and inflation rates affect people reasonably uniformly … and the stock market can be looked at as collective measure of the fear and greed of the population.  So, using the inflation rate as a trading filter seems to be a reasonable idea worthy of further testing.  What do you think?
     
    With many market watchers expecting the inflation rate to rise, this is something to consider.
     
    Enhanced by Zemanta
  • Here a Few Links for Your Weekend Reading Enjoyment

    I'm going to my son's graduation from Duke University this weekend.


    110513 Graduation Time

    Business Posts Moving the Markets that I Found Interesting This Week:

    • Does Venture Capital Data Show Signs Of Bubble? (Fortune)
    • Zogby Say 37% of Americans in Job Paying Less than Before. (TheDaily)
    • Krugman Warns Several Key Indicators Flashing Yellow (NYTimes)
    • Keynes And Hayek Square Off For Round Two of Economist Rap Battle (VIDEO) (HuffingtonPost)
    • Bullishness Waning: This Huge Contrarian Signal Might Send Stocks Higher. (BusinessInsider)
    • More Posts Moving the Markets.

    Lighter Ideas and Fun Links that I Found Interesting This Week

  • Markets Testing New Highs – Are You Bullish?

    Here is a video of a dog that wants to play fetch with a statue.


    This playful dog doesn't understand why the statue won't throw the stick, but it keeps trying. It reminds me of the games the market is playing to entice someone to play.

    The Markets Are Testing New Highs.

    While the S&P 500 is still below its high from October 2007, that NASDAQ Composite flirted inches from its highest close since December 12, 2000.

    So, Are You Bullish?

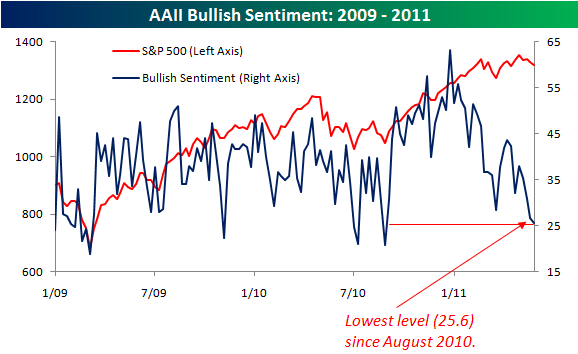
    We hear a lot about how investors are overly optimistic … but a look at the latest numbers from AAII shows that bullish sentiment has dropped to under 31%.  Again, we are near highs.  That isn't overly bullish; frankly, it seems a little strange.

    Normally, I would take the lack of bullishness as a contrarian indicator (meaning crowds are often wrong at turning points … so the lack of bulls would indicate a push higher was likely).  However, I'm starting to think that there is little "real" investor capital at risk in the U.S. Equity markets right now. 

    When the real money wants to play, I'm not sure it will like the game.


    Enhanced by Zemanta
  • A Few Ideas on Why the S&P 500 Has Held-Up So Well

    Recently, it has seemed like the market was looking for a reason to go up. Bad news was taken as a buying opportunity.

    There was a change in market sentiment last week. The market finally found reasons to sell-off.

    The move down was relatively minor and quite orderly. The S&P 500 is sitting comfortably in a support zone. The following chart shows that the move down did not come with panic selling and volume remained light.


    110509 Support Holding on the SP500 Index

    The move back to support burned-off some of the excess exuberance. So, on the next push down, let's see if sellers get another bear trap sprung on them with a pop higher.

    As I've said before, recently, if selling opportunities don't tempt sellers … Then the market will simply get pushed higher again.

    Remember, a trend is in force until it's reversed.  The broad equity indices are still behaving remarkably well. It could be a meaningful sign, or it could simply be a sign that there's a lot of money on the sidelines or in other markets.

    For example, last week was anything but orderly in the silver market.

    Enhanced by Zemanta
  • Here a Few Links for Your Weekend Reading Enjoyment

    Do you know what this is a picture of?
     
    110505-Mayo
    Well, it isn't a Mother's Day present.  It represents my hope that you had a fun Cinco de Mayo.
     
    Here are some of the links that caught my eye or attention … hope you find something interesting.

    Business Posts Moving the Markets that I Found Interesting This Week:

    • It's Harder To Get A Job At McDonald's Than It Is To Get Into Harvard. (BusinessInsider)
    • Is Apple Going To Be The First Trillion-Dollar Company? Here's the Short List. (VentureBeat)
    • China's Pushing the Yuan to be the Center of the New Financial Ecosystem. (WSJ)
    • Will Big Data Make Stock Exchanges Unnecessary?  (O'Reilly)
    • The Wall Street Journal Launches a WikiLeaks Competitor, SafeHouse. (Atlantic)
    • More Posts Moving the Markets.

    Lighter Ideas and Fun Links that I Found Interesting This Week

    Enhanced by Zemanta