Market Commentary

  • Do You Want to See What Fourteen Trillion Dollars Looks Like?

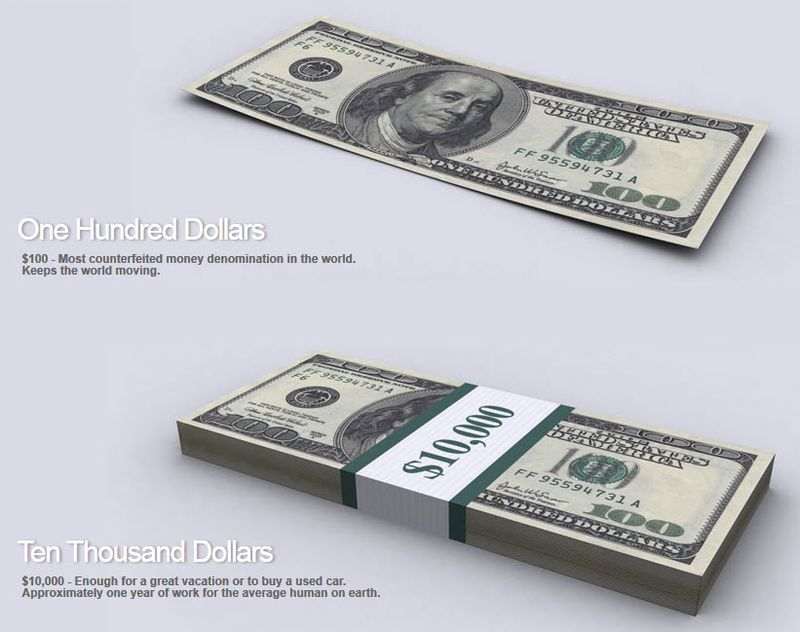
    Let's start with One Hundred Dollars.  A stack of them makes Ten Thousand Dollars.


    110725 Ten Thousand Dollars 
    So far, so good.

    Next, let's put One Hundred Million in perspective. 

    I don't know about you, but that still seems like a lot of money to me.  Nonetheless, it fits nicely on a military-standard pallet.


    110725 One Hundred Million Dollars 

    The U.S. Deficit is approaching Fifteen Trillion Dollars.  The image below will help you visualize that.  The scope and scale of that amount of cash is a surprising.


    110725 Fifteen Trillion Dollars 
     To see more, click here to go to a site called WTFNOWAY.

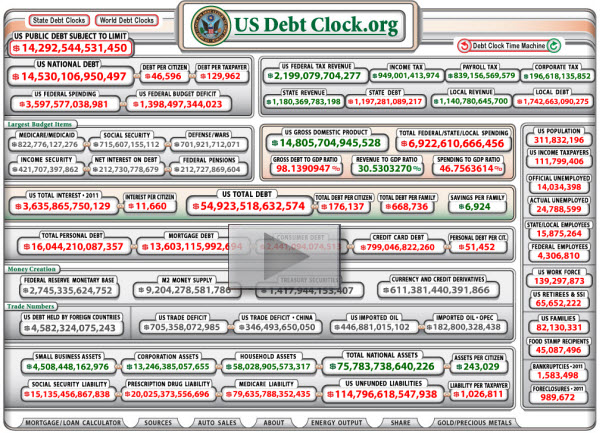
    And, if you want to see an updated, interactive version of the U.S. Debt Clock, just click the image below.  It is worth spending a little time to watch the pace the numbers turn.


    110724 US Debt Clock 
    Surprised?


    Enhanced by Zemanta
  • Does Crisis Really Mean Chaos and Opportunity?

    Is the glass half-full, or is the glass half-empty?

    It is all a matter of perspectives, isn't it.

    Let's look at one of the positives.  Some companies are doing fantastic. 

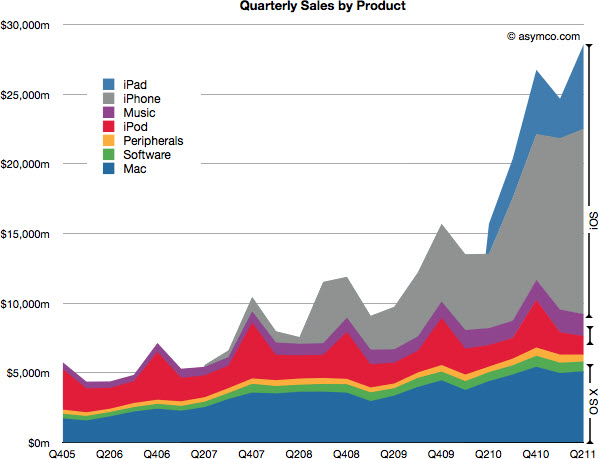
    Here is a chart of Apple's quarterly sales, by product.


    110723 apple-revenue 

    Apple grew revenues by 82 percent last quarter, which is remarkable growth for a company of its size ($28.6 billion in quarterly revenues).

    Can you remember another company, that size, growing revenue that fast?  I can't.

    You can talk about consumers having less money to spend, negative sentiment, etc.  It didn't matter.  Apple is showing that cream rises to the top.  If you make something people want, they will find a way to get it.

    How about the negative?  America isn't the only country with debt problems. 

    Deficit, National Debt and Government Borrowing – How Has It Changed?

    How has it changed?  It has gotten worse. 

    Here in the U.S., we talk about deficits, debt-ceilings, and government borrowing, as if we are the only country suffering.  But the news shows that this disease has spread through the world (and not just Greece either).

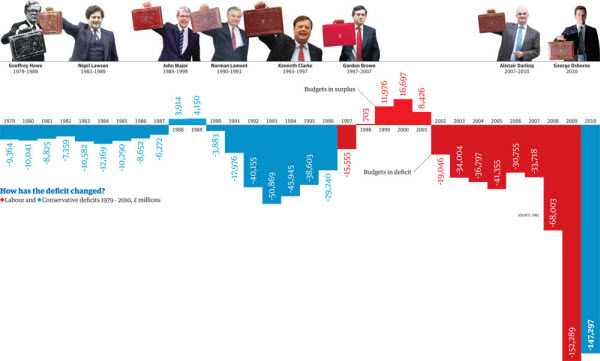
    For example, the chart below shows the United Kingdoms deficit over time.


    110723 UK Budget-deficits-graphic

    Does it look like a mirror of Apple's success to you?  Wonder what that means?

    At some point, a crisis is likely.  However, the chaos surrounding crisis often results in tremendous opportunity.

    Ultimately, it doesn't matter what happens … it is what you do. 

    Many opportunities present themselves every day in the markets.  The goal is to identify what is working, and to trade it while it is working.

    Niccolo Machiavelli said: "Whosoever desires constant success must change his conduct with the times."

    Perhaps it is time to make some plans so you respond intelligently to what happens.

    HMG Note: As I write this, there is still a failure to agree about the debt ceiling.

    If it isn't resolved before morning, international response should be telling.  Will it spark fear, or will the markets shrug it off?  The answer will probably tell you a lot more than the news did.

    Enhanced by Zemanta
  • Here a Few Links for Your Weekend Reading

    Here are some of the posts that caught my eye. Hope you find something interesting.

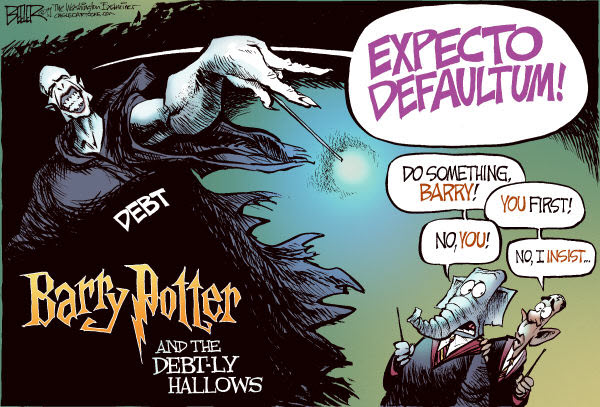
    Two scary things stood out.  U.S. debt is growing to magical proportions … and the final installment of the Harry Potter series, The Deathly Hallows, set box office records.


    Barry Potter and the Debtly Hallows - Beeler 

    Trading Links:

    Lighter Links:

  • Would a Move Lower Put Bulls Back On Firmer Ground?

    Sometimes little things can give you big clues about what is happening.

    Traders say that market opens are for retail traders, while market closes are for pros.

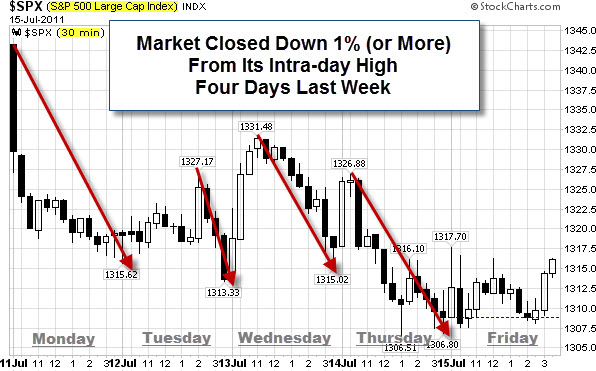
    Well, last week, the S&P 500 Index closed down at least 1%, from its intra-day high on four of five trading days.


    110716 SP500 Showed Some Selling 

    Sentiment has been negative; still, the markets have held-up surprisingly well.  Until sellers get bolder, this may be just another set-up for a move higher.

    Let's Look From a Longer Timeframe.

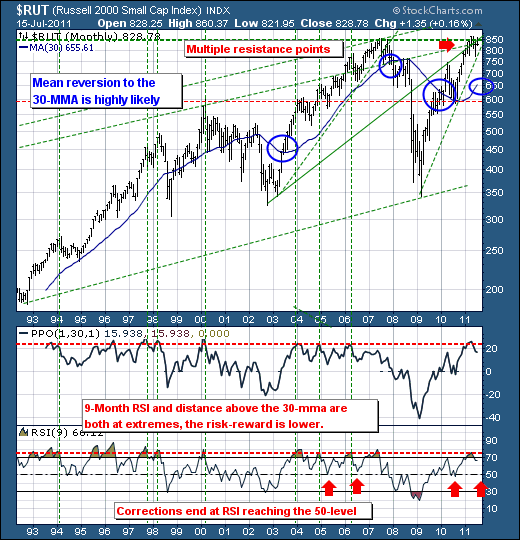
    The chart below shows the Russell 2000 Small Cap Index. While it is near highs, the Index is has having difficulty moving past its all-time highs (set in October 2007).  As a result, there are indications that momentum is sagging.

    Momentum seems like a pretty easy concept to understand.  For example, if you a throw a ball in the air, it has the least momentum at its peak.  After it hits the new high, but fails to go higher, it starts to fall.  Market momentum is a little trickier, because it doesn't always work like the laws of physics.


    110717 Russell 2000 

    In the process of the Russell 2000's failure to make new highs, traders may note that several indicators have started to flash "caution".

    Richard Rhodes notes that the 9-month RSI hit above the 70-level, while the distance above the 30-month moving average rose to above 20%. In the past, these types of indicator readings have allowed for "mean reversion" lower processes to take place back to the 30-month moving average, while the RSI trades lower towards the 50-level.

    This would be a normal correction in a bull market; and it may be the "pause that refreshes" before the market moves higher again. But it is important to realize that a mean reversion exercise would result in nearly a -20% decline from current price levels. 

    While scary, some would argue that such a pull-back would be just what was needed to put the Bulls back on firmer footing.

    Enhanced by Zemanta
  • Expectations are Low for 2nd-Quarter Results

    Recently, corporate earnings and the stock market have thrived, even as the economy has lagged.

    Meanwhile, we continue to get negative Jobs reports.

    Employment Numbers.

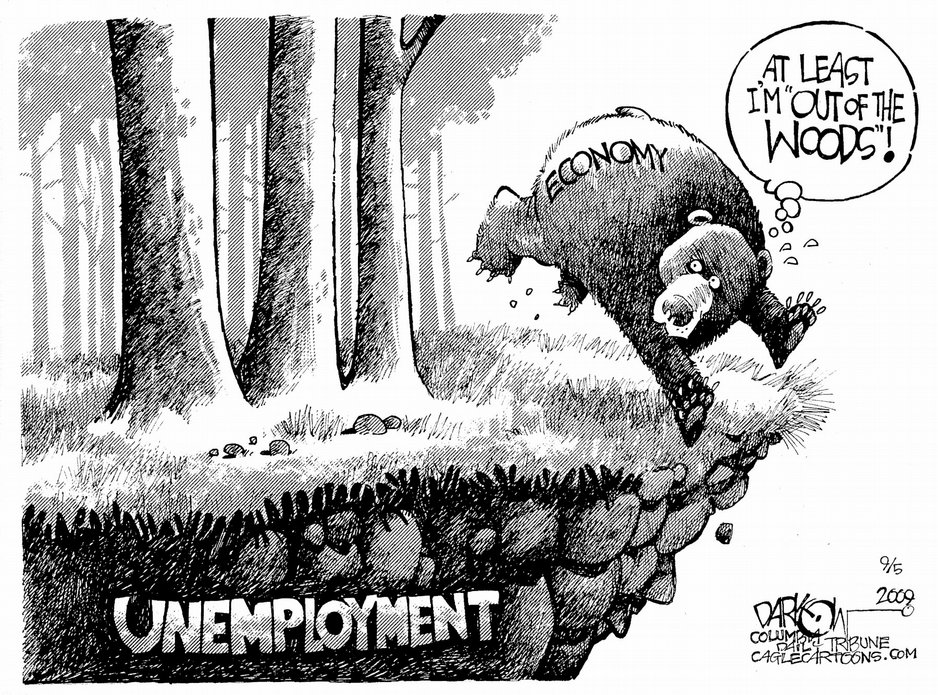
    Troubling unemployment numbers weaken the hopes of economic recovery.  It is worth pointing out that more companies seem to be hiring now.  Nonetheless, the numbers haven't been improving as fast as many would like (especially those still out of work).
     Sat_Edit_Darkow_090509_t938

    Have recent quarterly results (showing corporate profits) been based on cost-cutting, rather than real revenue growth?  If so, the results may not prove sustainable.

    As we move towards Q2 results, revenue will likely be a more telling indicator. This is something that bears watching.

    The Implications of Cost-Cutting.

    Jon Talton put out an interesting post; here is a small excerpt.

    If you missed the news, the new San Francisco-Oakland Bay Bridge is being built in China as modules to be assembled in California. Fourteen million Americans are officially unemployed and the U-6 (real) rate of unemployment in the Golden State is 22 percent.

    The project is, according to the New York Times, "part of China’s continual move up the global economic value chain — from cheap toys to Apple iPads to commercial jetliners — as it aims to become the world’s civil engineer."

    Whatever it is for China, it represents the "Catch-22" many companies (and governments) find themselves facing … how to save money, short-term, even if it has negative long-term consequences.

    Do You Expect to Hear Weak 2nd Quarter Results?

    Bespoke posted some research showing how pessimistic analysts are becoming about earnings.

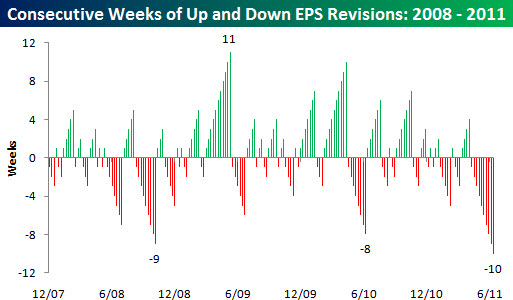
    They track the the number of companies in the S&P 1500 seeing positive and negative EPS revisions in a given week.  In the chart below they calculated the number of consecutive weeks that the net earnings revisions ratio increased or decreased.  

    Green bars indicate consecutive weeks where the revisions ratio increased, while Red bars indicate streaks where the earnings revisions ratio decreased.
     

    110710 EPS Revisions Up or Down
     

    As shown in the chart, the net earnings revisions ratio has now decreased for 10 consecutive weeks.

    This is the longest such streak of declining analyst sentiment, going back to the end of 2007.  It surpasses even the nine week streak seen in the aftermath of the Lehman bankruptcy.  

    Looking at this data, it is hard to argue that analysts are positive heading into this earnings season.

    Let's Look Under the Surface at Market Breadth.

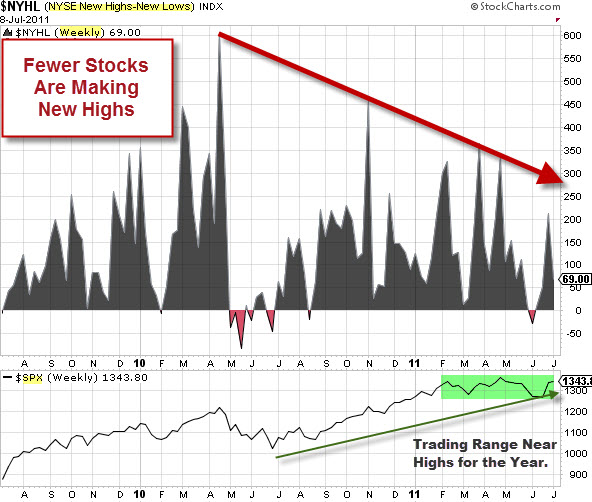
    This chart looks at NSYSE stocks making new 52-week highs, and subtracts the number of NYSE stocks making new 52-week lows. That means we get more Net New Highs when the markets are doing better.
     

    110710 New Highs Minus New Lows

    As it stands, even though the S&P 500 Index is making highs for the year, there are considerably less Net New Highs than we earlier in the year. While this is a little picky, it does constitute a negative divergence. Consequently, I'm watching what happen in this measure as a potential early indicator of market change.

    Enhanced by Zemanta