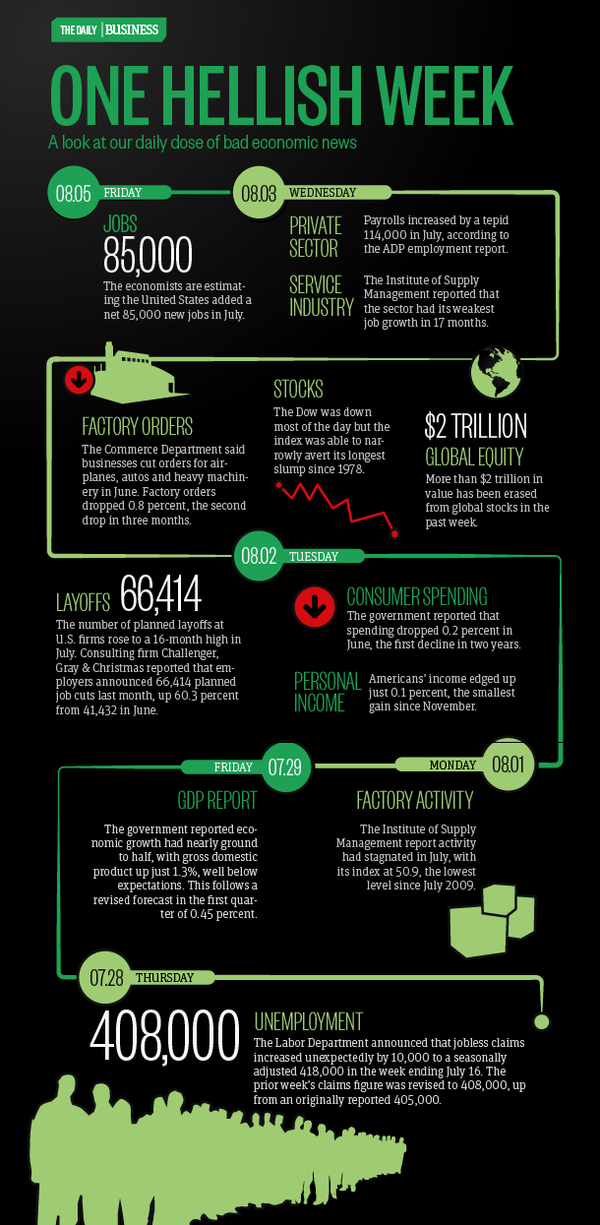
There was a fair amount of selling into a pretty consistent stream of bad news. But it ended without panic selling … and the Bulls can take some comfort in that.
However, one reason for the current earnings spike has been the fact that the US dollar has effectively been devalued.
Slash the yardstick by which financial performance is measured (e.g. dollars to dollarettes) and relative performance will appear more positive.
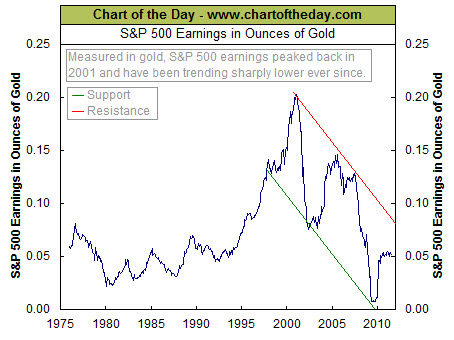
For example, when corporate earnings are measured in dollars, an investor will find that earnings are currently greater than what was achieved during the dot-com bubble and fast approaching the record levels that were achieved at the tail-end of the credit bubble. However, when measured in another world currency such as gold (see the chart below), the earnings picture isn’t quite so rosy.
This chart illustrates how S&P 500 earnings measured in ounces of gold actually peaked back in 2001, and has moved within the confines of a dramatic downtrend ever since.
From this perspective, the historic spike in earnings that began in the summer of 2009 doesn’t look all that historic, with current earnings coming in at a level that is significantly lower than what occurred at the conclusion of the dot-com and credit bubbles.
Here is a quote from Richard Russell, one of the well-known market commentators and Dow Theory experts:
"Gold will be around, gold will be money when the dollar and the euro and the yuan and the ringgitt are mere memories."
Let's start with One Hundred Dollars. A stack of them makes Ten Thousand Dollars.
So far, so good.
Next, let's put One Hundred Million in perspective.
I don't know about you, but that still seems like a lot of money to me. Nonetheless, it fits nicely on a military-standard pallet.
The U.S. Deficit is approaching Fifteen Trillion Dollars. The image below will help you visualize that. The scope and scale of that amount of cash is a surprising.
And, if you want to see an updated, interactive version of the U.S. Debt Clock, just click the image below. It is worth spending a little time to watch the pace the numbers turn.
Is the glass half-full, or is the glass half-empty?
It is all a matter of perspectives, isn't it.
Let's look at one of the positives. Some companies are doing fantastic.
Here is a chart of Apple's quarterly sales, by product.
Apple grew revenues by 82 percent last quarter, which is remarkable growth for a company of its size ($28.6 billion in quarterly revenues).
Can you remember another company, that size, growing revenue that fast? I can't.
You can talk about consumers having less money to spend, negative sentiment, etc. It didn't matter. Apple is showing that cream rises to the top. If you make something people want, they will find a way to get it.
How about the negative? America isn't the only country with debt problems.
Deficit, National Debt and Government Borrowing – How Has It Changed?
How has it changed? It has gotten worse.
Here in the U.S., we talk about deficits, debt-ceilings, and government borrowing, as if we are the only country suffering. But the news shows that this disease has spread through the world (and not just Greece either).
For example, the chart below shows the United Kingdoms deficit over time.
Does it look like a mirror of Apple's success to you? Wonder what that means?
At some point, a crisis is likely. However, the chaos surrounding crisis often results in tremendous opportunity.
Ultimately, it doesn't matter what happens … it is what you do.
Many opportunities present themselves every day in the markets. The goal is to identify what is working, and to trade it while it is working.
Niccolo Machiavelli said: "Whosoever desires constant success must change his conduct with the times."
Perhaps it is time to make some plans so you respond intelligently to what happens.
HMG Note: As I write this, there is still a failure to agree about the debt ceiling.
If it isn't resolved before morning, international response should be telling. Will it spark fear, or will the markets shrug it off? The answer will probably tell you a lot more than the news did.