German Chancellor Angela Merkel sent a pretty clear message to the Markets this weekend – that Europe's leaders will not be bullied into action just because the markets are throwing a fit about the speed of their actions.
Other highlights of her recent comments include:
“At this time — we’re in a dramatic crisis — euro bonds are precisely the wrong answer.”
“They lead us into a debt union, not a stability union. Each country has to take its own steps to reduce its debt.”
“Politicians can’t and won’t simply run after the markets.”
“The markets want to force us to do certain things. That we won’t do."
Cullen Roche, from Pragmatic Capitalism, says: if you’re a market speculator you can basically read her comments as such: “We are in no rush whatsoever to solve the crisis in Europe. We will not be swayed by market crashes or panics.” Interesting, because the markets are sending them a very clear message. There is a very serious risk of a banking crisis in Europe.
It's Not Just Europe.
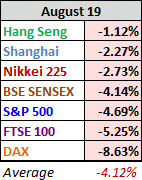
The world continued its sell-off last week. The table on the right shows the damage done to seven major markets.
The DAX was the biggest loser, down 8.63%. It's also the index that has slipped the furthest into bear territory, down 27.20% from its interim high set on May 2nd.
In fact, five of the seven are now in cyclical bear territory, down 20% or more from their interim highs: The DAX, Nikkei, Hang Seng, Shanghai, and the BSE Sensex.
The FTSE and S&P 500 remain above the traditional bear boundary, vying for the dubious designation as top performer during this world-wide correction.
How Do The Moves in Once Country Compare to Others?
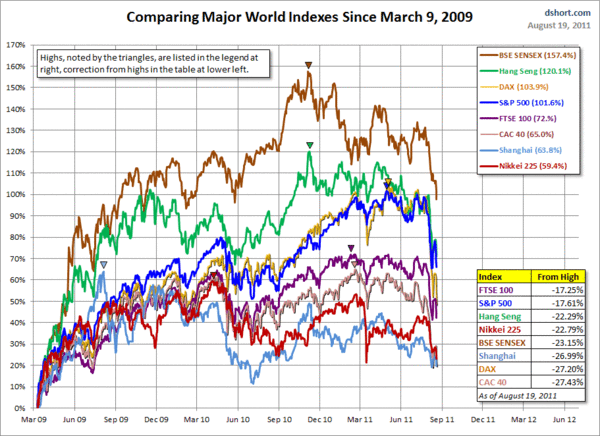
Here is a chart, from Doug Short, showing the comparative performance of World Markets since March 9, 2009.
It has been a tough few weeks for just about everyone.
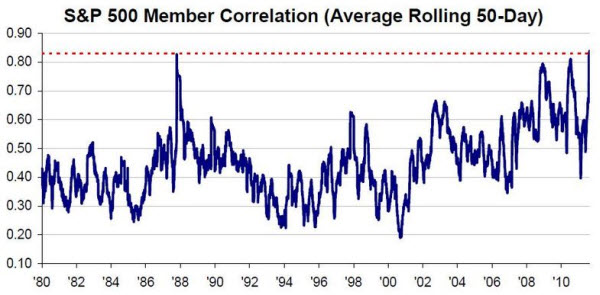
Laszlo Birinyi adds that stock correlation is also soaring. The average 50-day correlation of S&P 500 members to the index has risen to the highest levels since the market bottomed in 1987.
Are 'fat tails' are more likely to happen at the end of a crisis? If so, we might see a bottom soon. It bears watching to notice which sectors will break out as new leaders.
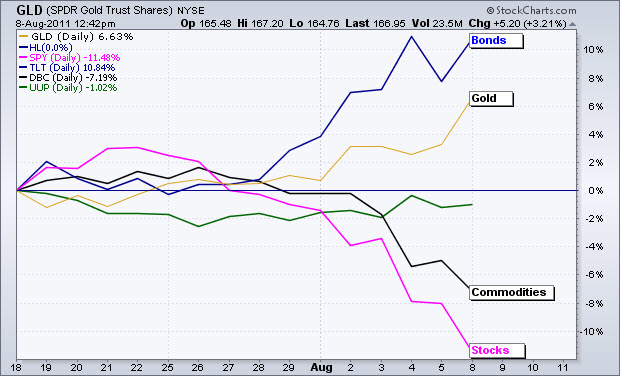
In short, the money flows show a re-pricing of risk. Stocks and commodities, which are viewed as riskier assets, declined over the last two weeks. Bonds and gold, which are viewed as safe-havens, advanced as alternatives. The Dollar, which is somewhere in the middle is virtually unchanged.
There Are Other Ways to Measure Fear.
The sell-off of the past few weeks triggered a number of extreme measures. Whether you look at volatility, price action, breadth, or volume, recent readings were off-the-charts. The table below is from Quantifiable Edges. It highlights some of those extremes.
However, every action brings a reaction … what can we expect next?
What Does the Volatility Bring?
We just saw four straight days with moves of 400 points or more in the Dow Jones Industrial Average … a first in its history. Is that just a meaningless market statistic?
Perhaps, instead, it is another indicator that we're at a significant extreme? If so, periods of great volatility are often followed by periods of relative calm. The logic is that bulls and bears fight until one side gives up (for a while); and the market pushes forward in the direction of the winner.
Looking For a Positive Sign? Here's a Promising Trading Signal.
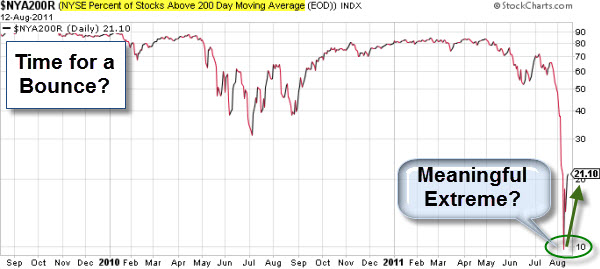
Last week, we got to a point where less than ten percent of NYSE stocks traded above their 200-day average. When the number of stocks that manage to stay above this moving average — a common measure of momentum — make a nasty two standard deviation move to the downside from the norm, it usually means an oversold market and a good time to buy.
After a tough week for the markets, the "Cherry-On-Top" is that the S&P downgraded the United States' credit rating.
Happy Birthday Mr. President, you now own the only credit downgrade in modern U.S. history.
It is going to be a tough week for Tim Geithner too. Did he really say there was ‘No Risk’ of a Downgrade? Unfortunately for him, there is a video showing that he did.
Here is an excerpt (from April 2011):
Peter Barnes “Is there a risk that the United States could lose its AAA credit rating? Yes or no?”
There was a fair amount of selling into a pretty consistent stream of bad news. But it ended without panic selling … and the Bulls can take some comfort in that.