Market Commentary

  • Is Big Tech Faking AI?

    Last week, I shared an article about Amazon's "Just Walk Out" technology – and how it likely required a team of human validators and data labelers.

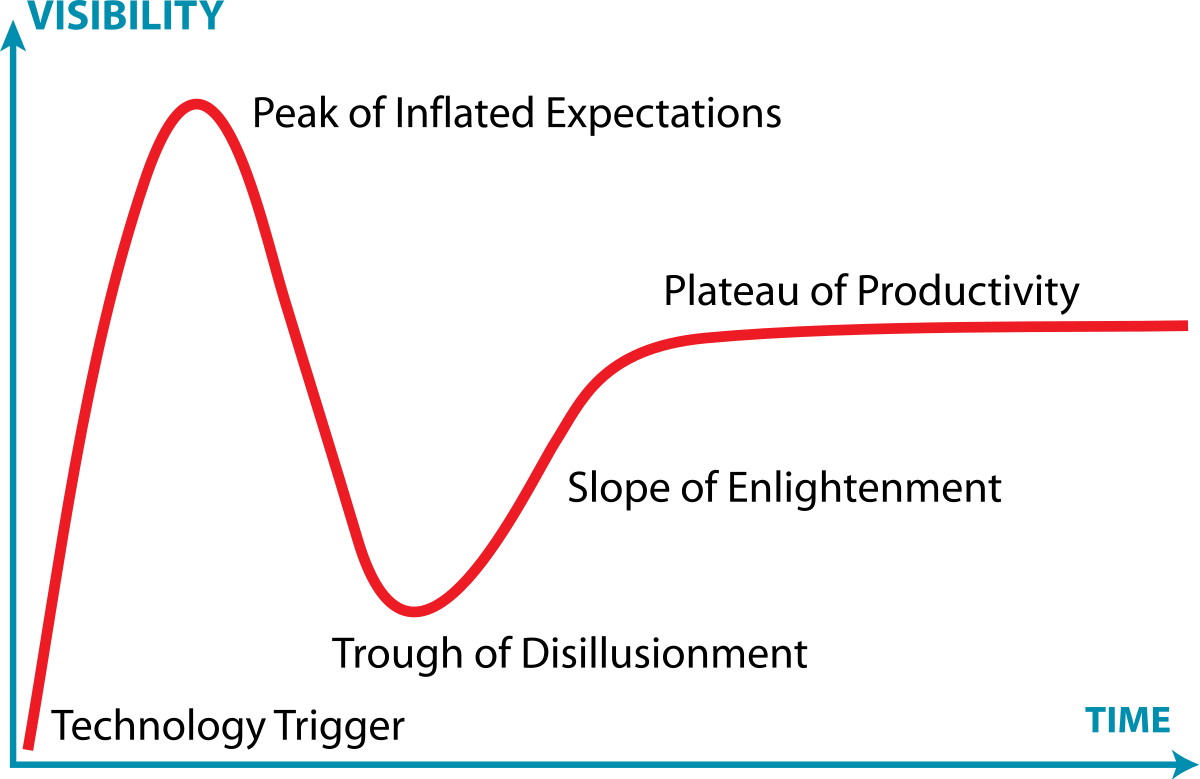
    My takeaway from the article was that we're right at the peak of inflated expectations and about to enter the trough of disillusionment. 

    Gartner hype cycle - Wikipedia

    Gartner via Wikipedia 

    One of my friends sent me this video, which he found in response.


    via Sasha Yanshin

    It's a pretty damning video from someone who is frustrated with AI – but it makes several interesting points. The presenter discusses Amazon's recent foible, Google's decreasing search quality, the increase of poorly written AI-crafted articles, GPTs web-scraping scandals, and the overall generalization of responses we see as everyone uses AI everywhere. 

    Yanshin attributes the disparity between the actual results and the excitement surrounding AI stocks to the substantial investments from technology giants. But as most bubbles prove, money will be the catalyst for amazing things — and some amazing failures and disappointments too.

    His final takeaway is that, regardless of its current state, AI is coming and will undoubtedly improve our lives. 

    If I were to add some perspective from someone in the industry, it would be this. 

    AI Is Overdelivering in Countless Ways

    There will always be a gap between expectations and reality (because there will always be a gap between the hype and adoption cycles). AI is already seamlessly integrated into your life. It's the underpinning of your Smartphones, Roombas, Alexas, Maps, etc. It has also massively improved supply chain management, data analytics, and more. 

    That's not what gets media coverage … because it's not sexy … even if it's real. 

    OverHype has existed for much longer than AI has been in the public eye. An easy example is the initial demo of the iPhone, which was almost totally faked,

    Having created AI since arguably the mid-90s, the progress and capabilities of AI today are hard to believe. They're almost good enough to seem like science fiction. 

    The Tool Isn't Usually The Problem 

    Artificial Intelligence is not a substitute for the real thing—and it certainly can't compensate for the lack of the real thing. 

    I sound like a broken record, but AI is a tool, not a panacea. Misusing it, like using a shovel as a hammer, leads to disappointment. And it doesn't help if you're trying to hammer nails when you should be laying bricks. 

    ChatGPT is very impressive, as are many other generative AI tools. However, they're still products of the data used to train them. They won't make sure they give you factual information; they can only write their responses based on the data they have.

    If you give an AI tool a general prompt, you'll likely get a general answer. Crafting precise prompts increases their utility and can create surprising results. 

    Even if AI independently achieves 80% of the desired outcome, it still did it without a human, a salary, or hours and days of time to create it. 

    Unfortunately, if you're asking the wrong questions, the answers still won't help you. 

    That's why it matters not only that you use the right tool but also that you use it to solve the right problem. In addition, many businesses lose sight of the issues they're solving because they get distracted by bright and shiny new opportunities. 

    Conclusion

    Sifting the wheat from the chaff has become more complicated — and not just in AI. Figuring out what news is real, who to trust, and what companies won't misuse your data seems like it has almost become a full-time job. 

    If you take the time, you will see a lot of exciting progress. 

    Public perception is likely to trend downward in the next news cycle, which is to be expected. After the peak of inflated expectations comes the trough of disillusionment. 

    Regardless, AI will continue to become more capable, ubiquitous, and autonomous. The question is only how long until it affects your business and industry. 

     - via Don't Walk Out on AI Just Yet

    What's the most exciting technology you've seen recently?

  • S&P 500 Performance In April

    "What goes up must come down" is a well-known aphorism. So is, "Actions have consequences, and so do inactions."

    On one hand, I try not to think about or predict markets (because I recognize the futility of trying to predict something random to me). On the other hand, it is an election year, and my opinion matters as a proxy for what people like me think or feel in an election year. So, with that in mind, I expected to see a brief market correction blamed on various geopolitical instabilities and partisan weaknesses, followed by a long and steady push higher as we approach the November elections.

    What do you think? Is the market's move downwards the start of something bigger, or is it just a temporary correction before a push higher into November?

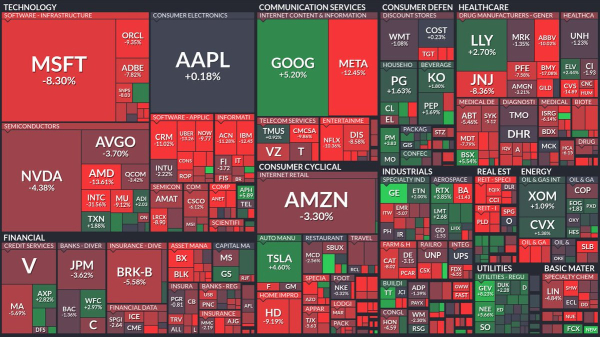
    Looking closer, 10 of 11 sectors in the S&P 500 lost money in April


    GMdJmaYW8AE55MW

    via FinViz

    Not to mention, for the past few years, the top 20 stocks have contributed almost exclusively to the success of the S&P 500. In 2023, the top 20 stocks drove 7.08% of the 7.55% return. 

    Those stocks are almost exclusively AI & Tech Stocks. 

    Often, people look to the S&P as a sign of the economy, but this is a helpful reminder that markets are not the economy. 

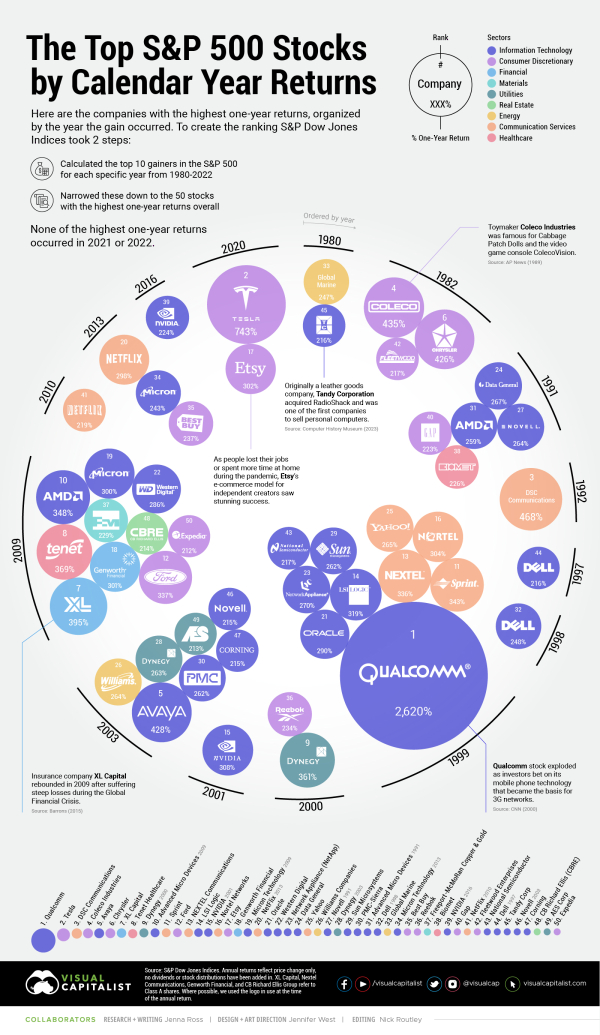
    As we look at the S&P, it's also interesting to look at the top stocks over the past 40 years. Visual Capitalist compiled a chart that ranks the top S&P 500 stocks by calendar year returns.


    Top-SP-500-Stocks-by-One-Year-Return_Mainvia Visual Capitalist

    Qualcomm's 2620% return in 1999 is hard to imagine, especially with Tesla's 743% percent growth from 2020 being a distant 2nd place. 

    In case you were wondering, Qualcomm's growth in 1999 was primarily driven by patents for Code Division Multiple Access (CDMA) technology, which was the infrastructure for "fast" wireless internet access and the 3G network.

  • Don’t Walk Out On A.I. Just Yet

    Amazon's 'Just Walk Out' technology has revolutionized shopping convenience, but whispers suggest there might be more to it than meets the eye…

    Retail-robot-hospitality-1

    For years, shoppers have been able to walk into one of their Amazon Fresh grocery stores,  walk out, and never have to talk to a single person, or even check out. 

    This feat was supposedly made possible solely using machine intelligence. 

    Just Walk Out technology is made possible by artificial intelligence like computer vision and deep learning techniques, including generative AI, to accurately determine who took what in any retail environment. Amazon built synthetic datasets to mimic millions of realistic shopping scenarios – including variations in store format, lighting conditions, and even crowds of shoppers – to ensure accuracy in any environment.via an Amazon Spokesperson

    However, they just announced that they're removing technology from their stores and switching to smart shopping carts. 

    Along with that announcement came rumors that the technology only worked due to a team of 1000 out of India. Apparently, this team was required to verify orders and correct the technology when it missed items. 

    On the one hand, that seems like a classic case of overpromising and underdelivering, but it's also very common. Many public-facing AI systems rely on human moderators and data labelers. 

    So why is Amazon being flogged in the media?

    The problem for me is two-fold. 

    First, Artificial Intelligence is at the peak of inflated expectations on Gartner's Hype Cycle. That means the average user has high hopes and is being disappointed. It also means the average user is likely overwhelmed with apps and technologies that fail to deliver on their promises. 

    Second, transparency is the name of the game, especially in a black-box situation like most AI. The technology Amazon is creating is impressive—but they're also Amazon. Eyes are on them to be leaders, so when they fall short, it's a chance for naysayers to pile on. 

    Public perception is likely to trend downward in the next news cycle, which is to be expected. After the peak of inflated expectations comes the trough of disillusionment. 

    Regardless, AI will continue to become more capable, ubiquitous, and autonomous. The question is only how long until it affects your business and industry. 

    While Amazon has "walked out" on that technology in its stores, it's not time to "walk out" on AI just yet. Numerous stores still use that or similar technologies.

  • The Next Big Thing … Megacities

    Population growth is an interesting measure. Historically, growth has been slow … but something changed that, and the implications are stunning.

    Scientists estimate that humans have existed for over 130,000 years.

    It wasn’t until 1804 that the world’s population reached 1 billion. The population doubled once more by 1927, 123 years later, and then again by 1974, a mere 47 years later.

    The Agricultural Revolution spurred early population growth. Subsequently, since 1804, the Industrial Revolution, alongside new technologies and advancements in health and safety, has dramatically enhanced the quality of life and accelerated population growth.

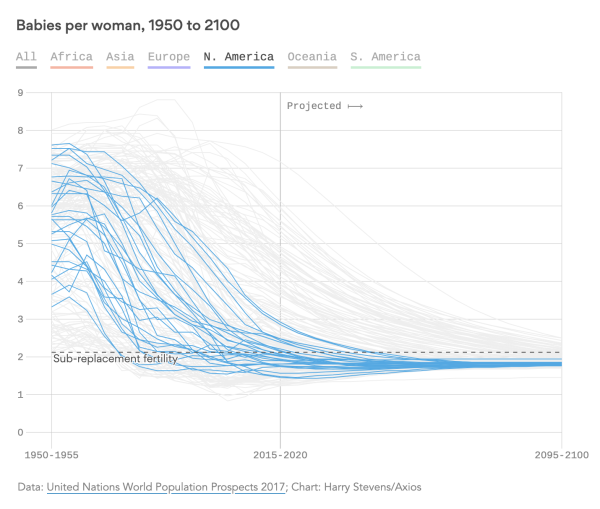
    The global population continues to expand as more women are giving birth, despite the statistical trend of each woman having fewer children. Here is a chart showing that.

    Screen Shot 2019-05-24 at 1.44.29 PM

    via Axios (Click for an Interactive Graph)

    World population growth rates peaked in the late 1960s and have declined sharply in the past four decades. Nonetheless, world population figures continue to grow. We’re expected to reach 9 billion people by 2050, but a lot of that growth comes from developing countries—it also almost exclusively comes from urban areas. 

    Urbanization: Megacities

    Here is another trend worth noting. Since 2014, over 50% of the world’s population has lived in urban areas – today it’s approximately 55%. That number is growing.

    Ironically, as we grow more digitally connected, our world is shrinking, and our populations are concentrating. 

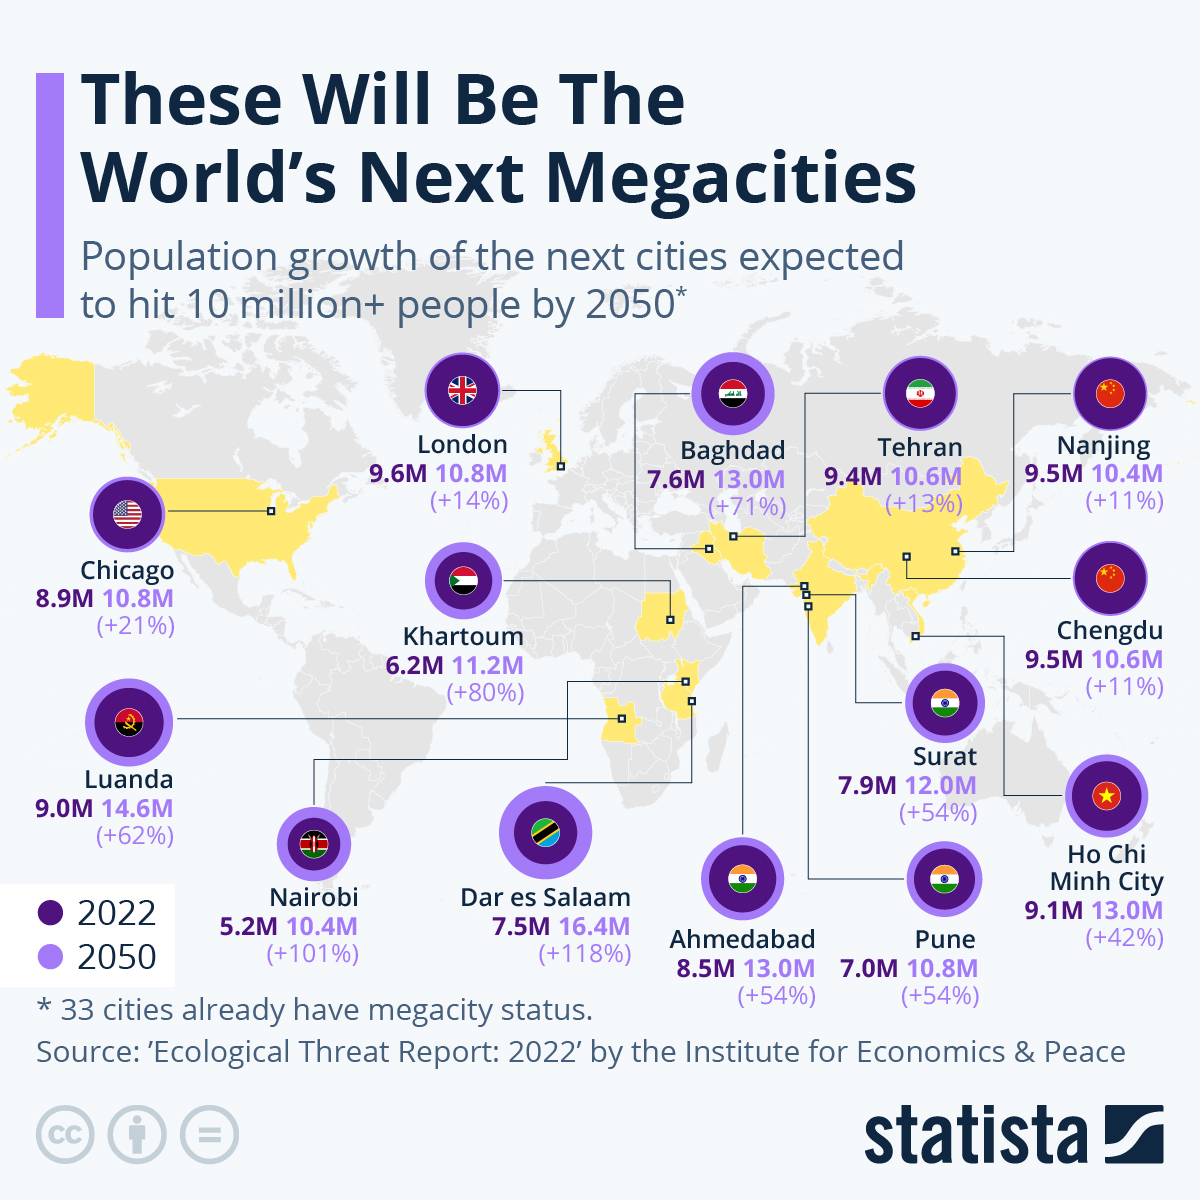
    An interesting consequence of this rapid urbanization and population growth in developing countries has been the increased development of Megacities – defined as cities with populations greater than 10 million. Today, there are 33 megacities – more than triple the number in the 1990s. 

    This creates a set of interesting opportunities and challenges. For example, how will these cities deal with infrastructure (e.g., sanitation, transportation, etc.)?

    Infographic: The World’s Next Megacities | Statista

    via Statista

    As information and money become increasingly decentralized, and it becomes easier and easier to trade and communicate globally, it’s interesting to see a centralization of the population. 

    What do you think the consequences will be?

  • The “Chart Of The Century” In 2024: A Look At Consumer Price Inflation

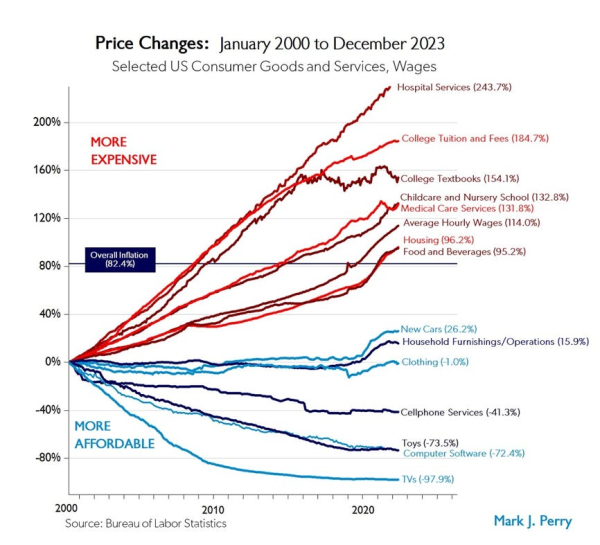
    This post considers the “Chart of the Century” created and named by Mark Perry, an economics professor and AEI scholar. This chart has received considerable attention because it contains extensive information about the challenges faced by the Fed and other Washington policymakers.

    The most current version reports price increases from 1998 through the end of 2023 for 14 categories of goods and services, along with the average wage and overall Consumer Price Index.

    It shows that prices of goods subject to foreign competition — think toys and television sets — have tumbled over the past two decades as trade barriers have come down worldwide. Meanwhile, the costs of so-called non-tradeable items — hospital stays and college tuition, to name two — have surged.

    From January 1998 to now, the CPI for All Items has increased by over 90% (up from 59.6% in 2019, when I first shared this chart).  

    Lines above the overall inflation line have become functionally more expensive over time, and lines below the overall inflation line have become functionally less expensive. 

    Time-Pricing-Mark-Perry-image-01

    via Human Progress

    At the beginning of 2020 (when I shared the 2019 post), food, beverages, and housing were in line with inflation. They’ve now skyrocketed above inflation, which helps to explain the unease many households are feeling right now. College tuition and hospital services have also continued to rise over the past few years—even in relation to inflation. 

    There are many ways to interpret this chart. You can point to items in red whose prices have exceeded inflation as government-regulated or quasi-monopolies. You can point to items in blue as daily commodities that have suffered from ubiquity, are subject to free-market forces, or are goods subject to foreign competition and trade wars.

    Looking at the prices that decrease the most, they’re all technologies. New technologies almost always become less expensive as we optimize manufacturing, components become cheaper, and competition increases. From VisualCapitalist, at the turn of the century, a flat-screen TV would cost around 17% of the median income ($42,148). In the early aughts, though, prices began to fall quickly. Today, a new TV will cost less than 1% of the U.S. median income ($54,132).

    Compare “tradable” goods like cell phones or TVs (with lots of competing products) to less tradable “goods” like hospital stays or college tuition, and unsurprisingly, they’ve gone in opposite directions. In 2020, I asked what the Coronavirus would do to prices, and the answer was less than expected. If you don’t look at the rise in inflation but instead the change in trajectories, very few categories were heavily affected. While hospital services have skyrocketed since 2019, they were already skyrocketing. 

    At this point, we’re pretty far removed from quarantine’s most extreme forces. Textbooks have come back down, as have childcare and medical care services. New cars and household furnishings have leveled out. Otherwise, the trajectories have been pretty unaffected.

    We can look one step deeper if we consider average hourly income. Since 2000, overall inflation has increased by 82.4%, while average hourly income has increased by 114%. This means that hourly income increased 38% faster than prices (which indicates a 14.8% decrease in overall time prices). You get 17.3% more today for the same amount of time worked ~24 years ago.

    It’s interesting to look at data like that, knowing that the average household is feeling a “crunch” right now. My guess is that few consumers distinguish between perception and reality. However, feeling a crunch isn’t necessarily the same as being in a crunch.

    For instance, we must account for ‘quality of life creep,’ where people tend to splurge on luxuries as their standard of living improves. With the ease of online shopping and access to consumer credit, it’s become increasingly easy to indulge in impulse purchases, leading to reduced savings and feelings of financial scarcity. This phenomenon is a function of increased consumption (rather than inflation), yet it still leaves consumers feeling like they’re struggling to make ends meet.
     
    Perry’s ‘Chart of the Century’ reveals the complex relationships between inflation, consumption, and economic growth. While households may feel financial strain, the data shows that income has outpaced inflation, and technology has made many goods more affordable. Nonetheless, our tendency to splurge on luxuries and increased consumption have contributed to a sense of financial struggle.
     
    How can policymakers address the sectors experiencing significant price hikes, like healthcare and education, without stifling innovation in tradable goods and services? 
     
    How do you think these issues will impact the Election?
  • The Growth of 100 Dollars since 1970

    There has been a lot of discussion about consumer price inflation recently.

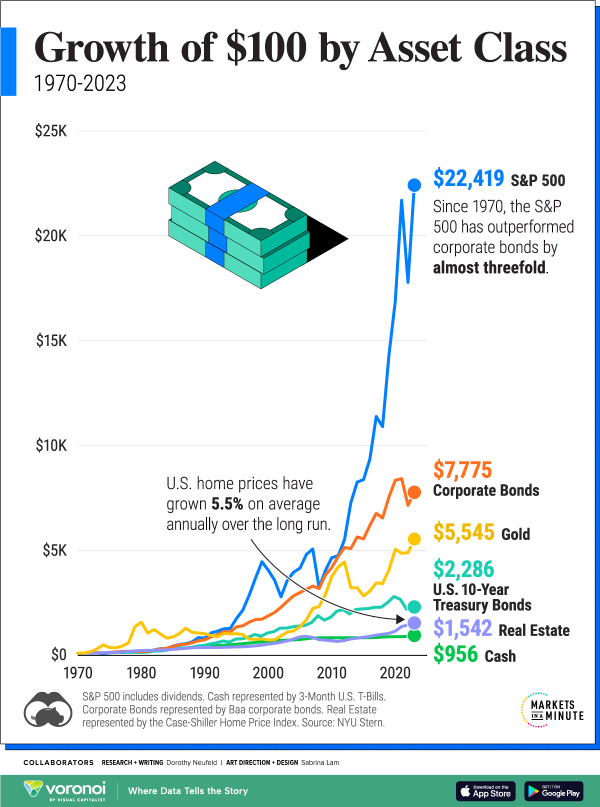
    For a slightly different perspective and a longer-term view, take a look at this chart on VisualCapitalist. It shows the growth of $100 by asset class from 1970 – 2023.


    The-Growth-of-100-by-Asset-Class_website_Apr10jpg

    via visualcapitalist

    I was surprised to see how little real estate grew … but I wasn't surprised by the S&P 500 number. 

    The real estate number is more complicated than it appears on the surface (since it factors in leverage, property taxes, insurance, and other expenses). It also factors in the housing market crash, from which home prices took over a decade to recover. 

    For some context, here are some key events that highlight the difference between 1970 and 2023:

    Technology
    • 1970: First microprocessor introduced
    • 2023: Artificial intelligence, Blockchain, and Quantum Computing are rapidly advancing
    Space Exploration
    • 1970: First lunar module lands on the Moon (Apollo 11)
    • 2023: Private companies like SpaceX and Blue Origin lead the charge in space travel and exploration
    Politics and World Events
    • 1970: Cold War and Vietnam War dominate global politics
    • 2023: Rise of globalization, social media, and geopolitical tensions between major world powers
    Economy and Business
    • 1970: Industrial economy dominates
    • 2023: Service-based economy and e-commerce have transformed the way we work and shop
    Communication
    • 1970: Landline phones and snail mail are the primary means of communication
    • 2023: Smartphones, social media, and instant messaging have revolutionized the way we connect and share information
    These are just a few of the many events that highlight the significant differences between 1970 and 2023.
     
    Try to imagine what the next 50 years hold!
     
    My guess is that the changes will be exponential.
     
    Onwards!
  • The Real Business We’re All In …

    I’ve given a few speeches recently and have new subscribers to our weekly commentary (click here to sign up), so I thought it was a good time to write about the importance of data.

    I revisit this topic about once a year because it’s important. 

    The Hidden Engine: Why Data Fuels Innovation

    Technology and innovation are popular topics, but people often ignore what makes it all possible …  the hidden foundation,  data.

    Data is the lifeblood of modern businesses and the fastest-growing resource we have.

    The quest to find and use data has created a modern-day “Wild West.” While AI is often positioned as a “Gold Rush,” data is the precious resource powering the race.

    Another way to look at it is that data is the ammunition used by today’s tech titans in their battle for dominance.

    In either case, it is easy to see that data is a scarce and valuable resource.

    The Data Deluge: Finding Signal in the Noise

    We’re living in an age of data explosion.  Every day, a staggering 328.77 million terabytes of data are created, amounting to an estimated 120 zettabytes of new data by year’s end.

    Video is a significant driver, but so is the Internet of Things, which is growing more than 15% annually.  There are now almost 20 billion connected devices, and that number will continue to grow. 

    This rapid growth presents a challenge.  Tech giants like AlphabetAmazonAppleFacebook, and Microsoft all hold unprecedented data troves, creating a race for ownership and control.  Regulations struggle to keep pace with this digital stampede.

    Rapid growth means little time to create adequate rules.  Everyone’s jumping to own more data than the next and to protect that data from prying eyes.

    As a great example of this, I often warn people to keep their intellectual property off of ChatGPT or other hosted language models. 

    But here’s the real concern: Are we losing sight of the signal in all this noise?  Just having vast amounts of data isn’t enough.  The true value comes from extracting meaningful insights – the nuggets of gold buried within the data avalanche.

    To Do The Impossible, Make The Invisible Visible

    Collecting basic data and using basic analytics used to be enough, but it is not anymore.  The game is changing. 

    I also see it trading, but it’s pervasive in every industry and our personal lives as well. 

    For example, traders used to focus on price data … but there has been an influx of firms using alternative data sets and extraordinary hardware and software investments to find an edge.  If you’re using the same data sources as your competitors and competing on the same set of beliefs, it’s hard to find a sustainable edge. 

    Understanding the game others are playing (and its rules) is important.  However, that’s only table stakes.

    Figuring out where you can find extra insight or where you can make the invisible visible creates a moat between you and your competition and lets you play your own game.

    Here is a quick high-level video about Data as fuel for your business.  Check it out.


    It is interesting to think about what’s driving the new world (of trading, technology, AI, etc.), which often involves identifying what drove the old world.

    Decoding the New World: Data as the Catalyst

    Understanding today’s driving forces – like AI – often involves examining what propelled past eras.

    History has a way of repeating itself.  Even when it doesn’t repeat itself, it often rhymes.

    Before e-mails, fax machines were amazing.  Before cars, people were happy with horses and buggies.

    The key to unlocking new economic realities lies in fresh perspectives.

    In this new world, new or better data is often the game-changer.  It’s the alternative dataset that allows us to approach challenges and opportunities from entirely new angles.

    Before data analytics, businesses relied on intuition and limited information.  Now, data empowers us to see patterns and make data-driven decisions, propelling innovation at an unprecedented pace.

    These comparisons help explain the importance of data in today’s new world economics.

    One of the more recent shifts is in the value of synthetic data

    SymtheticData
    via Gartner

    Synthetic data can mimic the statistical properties of real-world data, making it useful for a variety of purposes.

    For example, synthetic data can be used to train machine learning models when collecting traditional data is impractical or presents privacy concerns.  It is also used in various other applications, such as data privacy, testing and development, data augmentation, simulation and modeling, risk assessment and management, and enhancing data quality.

    You don’t have a competitive advantage if you use the same data and the same process as other people.  That’s why understanding how to recognize and capture synthetic data is important.  It can shift your perspective, add dimensionality, help you solve different problems, and create transformative results.  

    In the very near future, I expect these systems to be able to go out and search for different sources of information. It's almost like the algorithm becomes an omnivore. Instead of simply looking at market data or transactional data, or even metadata, it starts to look for connections or feedback loops that are profitable in sources of data that the human would never have thought of. – Howard Getson

    While data is the foundation, it’s about transforming your data into actionable insights. 

    By identifying your real business, the KPIs of success, and what data you’re underutilizing, you can massively improve the efficiency and effectiveness of your business and create new products that transform your future. 

    In a word of caution, there are two common mistakes people make when making data-driven decisions.  First, people often become slaves to the data, losing focus on the bigger picture.  This is the same mistake people make with AI.  Both are tools, not the end goal.  Second, even the most insightful data can’t predict black swans.  It’s essential to exercise caution and prepare for the unexpected. 

    The future of data is bright, but it’s also littered with potential challenges.  Privacy concerns and data misuse are hot-button topics, as are fake news and the ability of systems to generate misleading data.  In addition, as we gain access to more data, our ability to separate signal from noise becomes more important.

    One of the biggest problems facing our youth—and really all of us—is how much information is thrust at us every waking moment of the day.  No previous generation has had this much access to data.  As a result, many are actually less informed than in the past.  Soundbites become the entire news story, and nuance gets lost in the echo chambers. 

    The question becomes, how do you capitalize on data without becoming a victim of it? 

    Food for thought!

  • Where Does a U.S. Tax Dollar Go?

    With tomorrow being the deadline to submit your taxes (if you haven't filed an extension), it feels appropriate to look at where your tax dollars go. 


    VORO_Tax-Dollar_MAIN

    via visualcapitalist

    This is obviously an approximation, but it's an interesting one nonetheless. 

    Social Security is the largest draw, but it is also one of the public services at the highest risk of failure due to an increasingly large aging population (with fewer active workers contributing to the system). 

    Unsurprisingly, Health and National Defense are the next biggest draws from your taxes. Medicare and Medicaid are expensive, and we do have the largest military force, by a large margin. We spend more on defense than the following ten countries combined

    It's interesting to see … but I might add a cent to my tax dollar if it meant they'd fix all these potholes. 

  • March Is Always Madness …

    March Madness is in full swing and will have the world's attention for a few more days.  As you can guess, almost no one has a perfect bracket anymore.  Yale beat Auburn, James Madison beat Wisconsin, Michigan State beat Mississippi State, and by the end of day 1, only 2,000 brackets remained intact.  That's .008% of all brackets submitted

    Before 24/7 sports channels, people watched the weekly show "The Wide World of Sports."  Its opening theme promised "The thrill of victory and the agony of defeat!" and "The human drama of athletic competition." That defines March Madness.

    The holy grail is mighty elusive in March Madness (as in most things).  For example, the odds of getting the perfect bracket are 1 in 9,223,372,036,854,775,808 (2.4 trillion based on a Duke Mathematician's formula that takes into account rank).  It's easier to win back-to-back lotteries than picking a perfect bracket.  Nonetheless, I bet you felt pretty good when you filled out your bracket.


    via Duke University

    Here's some more crazy March Madness Stats: 


    Feeding the Madness

    "Not only is there more to life than basketball, there's a lot more to basketball than basketball." – Phil Jackson

    In 2017, I highlighted three people who were (semi) successful at predicting March Madness: a 13-year-old who used a mix of guesswork and preferences, a 47-year-old English woman who used algorithms and data science (despite not knowing the game), and a 70-year-old bookie who had his finger on the pulse of the betting world.  None of them had the same success even a year later.

    Finding an edge is hard – Maintaining an edge is even harder.

    That's not to say there aren't edges to be found. 

    Bracket-choosing mimics the way investors pick trades or allocate assets.  Some people use gut feelings, some base their decisions on current and historical performance, and some use predictive models.  You've got different inputs, weights, and miscellaneous factors influencing your decision.  That makes you feel powerful.  But knowing the history, their ranks, etc., can help make an educated guess, and they can also lead you astray. 

    The allure of March Madness is the same as gambling or trading.  As sports fans, it's easy to believe we know something the layman doesn't.  We want the bragging rights of that sleeper pick, of our alma mater winning, of the big upset. 

    You'd think an NCAA analyst might have a better shot at a perfect bracket than your grandma or musical-loving co-worker.

    In reality, several of the highest-ranked brackets every year are guesses. 

    The commonality in all decisions is that we are biased.  Bias is inherent to the process because there isn't a clear-cut answer.  We don't know who will win or what makes a perfect prediction. 

    Think about it from a market efficiency standpoint.  People make decisions based on many factors — sometimes irrational ones — which can create inefficiencies and complexities.  It can be hard to find those inefficiencies and capitalize on them, but they're there to be found. 

    In trading, AI and advanced math help remove biases and identify inefficiencies humans miss.

    Can machine learning also help in March Madness?

    “The greater the uncertainty, the bigger the gap between what you can measure and what matters, the more you should watch out for overfitting – that is, the more you should prefer simplicity” – Tom Griffiths

    Basketball_5faa91_405080

    The data is there.  Over 100,000 NCAA regular-season games were played over the last 25+ years, and we generally have plenty of statistics about the teams for each season.  There are plenty of questions to be asked about that data that may add an extra edge. 

    That being said, people have tried before with mediocre success.  It's hard to overcome the intangibles of sports – hustle, the crowd, momentum - and it's hard to overcome 1 in 9.2 quintillion odds. 

    Two lessons can be learned from this:

    1. People aren't as good at prediction as they predict they are.
    2. Machine Learning isn't a one-size-fits-all answer to all your problems.

    Something to think about.

  • The First Neuralink Patient’s #1 Priority

    Neuralink received approval for human trials of its PRIME Brain-Computer Interface in September 2023.

    In January, Elon took to Twitter and announced that the first human recipient had received an implant and was showing promising neuron spike detection. 

    Neuralink designed PRIME to record and transmit neural data to interpret brain activity into movement intention. The PRIME Brain-Computer Interface empowers disabled individuals by enabling them to communicate and engage with the world in innovative and impactful ways, such as regaining the ability to speak and interact with others. In the future, advancements in the PRIME Brain-Computer Interface could even assist individuals with spinal cord injuries learn to walk again.

    The first patient was 29-year-old Noland Arbaugh, a complete quadriplegic who had lost sensation and suffered paralysis from below the shoulders after sustaining a spinal injury during a diving accident eight years ago.

    When we first began receiving updates about him, we were excited to hear that he could use a computer cursor. That was a big step … and the start of many others. Now, we're being told that he recently used the technology to stay up all night playing a video game called Civilization 6.

    Similarly, in 2022, a completely paralyzed man used his brand-new brain implant to ask his caregivers for a beer

    It sounds like a joke, but these are the types of stories that make me optimistic. Both examples highlight a new capability … but also a deeper purpose, freeing the human to enjoy being human and enhance the quality of their life.

    This is a great reminder. Media coverage often focuses on the fear of an increasingly tech-driven world, and what it means for humanity … but the best uses of technology allow us to be more human. 

    What used to be science fiction is becoming reality, and possibilities are becoming inevitabilities. 

    Onwards!