Ideas

  • The Financial Race Towards the Presidency

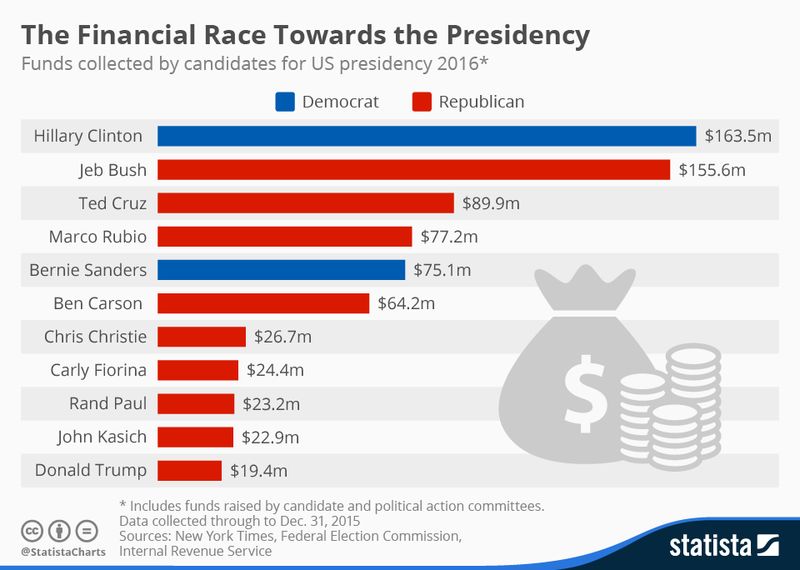
    The race for the White House is always a race for funds. Last week's Iowa caucus sheds a spotlight on the correlation of fund-raising success and success at the polls.

    via Statista.


    While he didn’t come out on top in the Iowa Caucus, Donald Trump surely has proven he knows how to make the biggest bang for the buck. While he isn’t even in the top ten of the best funded candidates (of both parties) … He still achieved a second place showing in the Republican candidates in Iowa.

    The Republican winner was Ted Cruz, who is the second best funded in the GOP camp.  

    In contrast, while Jeb Bush is the best funded Republican candidate (second overall after Democrat Hillary Clinton), he only managed a sixth place finish against the Republicans in the Iowa caucus.

    While Cruz has a comfortable lead over Trump in the caucus in the Republican camp, Democratic hopeful Clinton has the most money of all candidates, democratic and overall. She virtually tied with second best funded Democrat Bernie Sanders in the caucus, who’s only in fifth place of the best funded overall.

  • What Knee Surgery Reminded Me About Technology

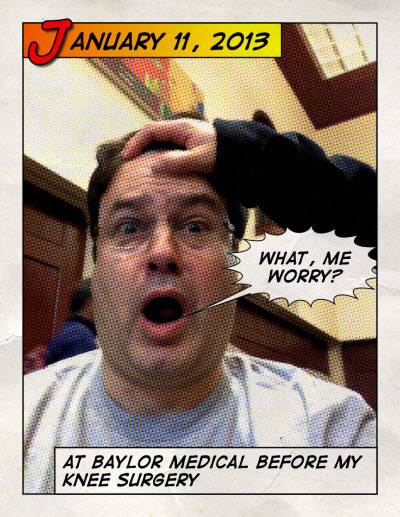
    This week, my son had knee surgery.  It made me remember my knee surgery from three years ago … And, it reminded me about what technology makes possible.

    Before my knee surgery, I wasn't enjoying the prospect of the needles, the knock-out drugs, the cutting, or the recovery process.  Frankly, I was scared.


    130113 What - Me Worry
     

    History is littered with tales of once-rare resources made plentiful by innovation. The reason is pretty straightforward … scarcity is often contextual.

    Imagine a giant orange tree packed with fruit. If you pluck all the oranges from the lower branches, you are effectively out of accessible fruit. From that limited perspective, oranges are now scarce. But once someone invents a piece of technology called a ladder, the problem is solved.

    Here is a picture from inside my knee (unlike years ago, they didn't have to rip me open to gain access for the picture or the repair). Less damage, less time, less drugs, less recovery.


    130113 Knee Surgery


    Bottom-Line: I walked over 2,500 steps the day after the surgery.  This time, my son and I had a burger on the way home from his surgery.

    Whether it is minimally invasive surgical instruments, or linking big data and elastic computing … Technology is a resource-liberating mechanism. It can make the 'once scarce' the 'now abundant' (or 'readily accessible') … and a lot less painful.

    Pretty Cool!

    Enhanced by Zemanta
  • How You’ll Probably Die, Visualized

    Bad news sells.  All the talk of bombings, health scares, and obituaries can make a person contemplate their impending death.
     
    Good news … There is an infographic for that.

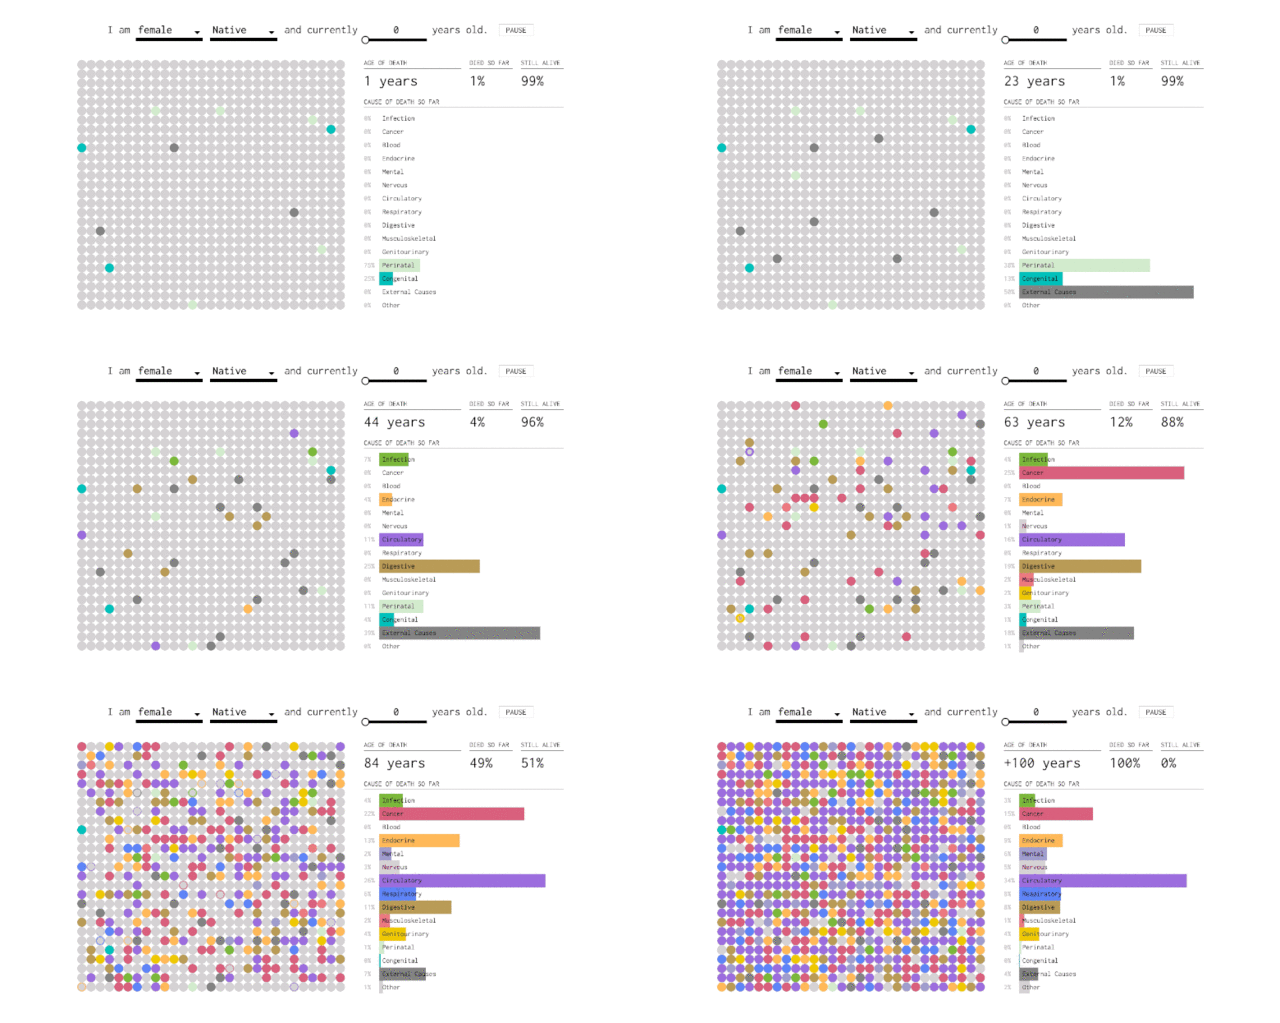
    Flowing Data has previously visualized when we'll die and how our loved ones will die.  Now, they have put together an interactive infographic that charts out how you will likely die, based on how many years you've lived.

    160123-how-you-will-die

     via Flowing Data.

    Here's how it works: go to the infographic on the Flowing Data page and enter your sex, race, and age into the blanks at the top of the infographic. On the left side, each dot represents the death of a simulated self, and the color of each dot corresponds to a cause of death (infection, cancer, circulatory problems, external causes, etc.). As each year passes, more of your simulated selves die. On the right side, a bar graph keeps tabs on your cumulative percentages. When the animation ends (at year 100), you're left with the percent likelihood that you will die of each cause.

    It's an interesting way to visualize the data because it shows not only your chances of dying from a certain disease but your likelihood of dying in general during certain phases of your life.

    The results have one pretty obvious takeaway—your chances of dying increase as you age—but it's fascinating to watch how the chances change in different age groups. Shift the age to 0, and you'll see that once you get past year one, the dots accumulate slowly over the next few decades (chances of death, from anything, are low). Past 30, the dots change color more quickly (you get the point).

    Ultimately, we all have to go one way or another.

    Let's just hope it is later.

  • After the Bombings, Jakarta Returned to Normal Quickly

    Time Is Precious, Enjoy It

    I was in Jakarta during the bombings last week.  

    Restaurants and Malls emptied.

    Yet, crazy returned to calm quickly.

    Kids went to school the next day.

    A day later, I went to a wedding (hence the balloon).

    Normal is nice … and nice is normal!

    It serves as a reminder that time is the most precious resource we have.  

    Use it wisely.

  • Happy New Year

    Best wishes to you and yours.  JibJab nailed my resolutions for the year!


    JibJab via YouTube.

    Looking forward to a great 2016!

  • Happy New Year

    Best wishes to you and yours.  JibJab nailed my resolutions for the year!


    JibJab via YouTube.

    Looking forward to a great 2016!