Ideas

  • Capitalogix Commentary 05/10/09

    The market has been tenaciously bullish recently. Apparently it's working, because I hear an increasing amount of people optimistic about the markets.

    I'm glad that our trading is based on mechanical models, because recently mechanical models have worked quite well. 

    Personally, though, I'm feeling a lot more cautious.  The markets seem pathologically bullish; and I am looking for a pull-back.

    What concerns me is that we haven't seen the back and forth … two steps forward, then one step back, rhythm that I've come to trust. Instead I sense something artificial and likely to break down. For example, since this rally began in early March, there have only been four days with negative reversals greater than 1%.

    Can The Economies Of This Many Countries All Get Fixed At The Same Time?

    Moreover, a quick glance around the globe shows remarkably similar bullish performance in many markets.

    090508 World Markets

    To get a closer look for yourself, here is a link to the charts.

    Other Signs That We're Approaching Over-Extended.

    I'm starting to see the Smart Money lighten up their bets at the same time I'm seeing retail investors starting to get back into the game; and the VIX is at a low not seen since last September. It feels like we are getting close to the type of confidence spread that often immediately precedes a major turning point.  It is the point where the market is making higher highs, while smart traders are becoming more risk-averse. This negative divergence often perceives market pullbacks.

    Again, in my opinion, a pullback from this level is expected and perhaps even healthy. What I'm looking for is to see a healthy correction and then, hopefully, organic buying from the Smart Money.

    Elliott Wave Pattern.

    I was talking to a friend of mine who successfully trades using Elliott Wave as a framework for understanding the market.  And I thought this might be an interesting time to re-visit this technique.

    The premise is that the market doesn't affect sentiment.  Rather, it is the other way around;  collective sentiment affects the market.  And that while markets change, human nature doesn't … consequently, predictable patterns play out over and over again.

    While I now look at Elliott Wave more as a way of understanding what the market has done (rather than a great predictor of what it will do next), I do believe it is helpful in getting a sense of the next likely swing. 

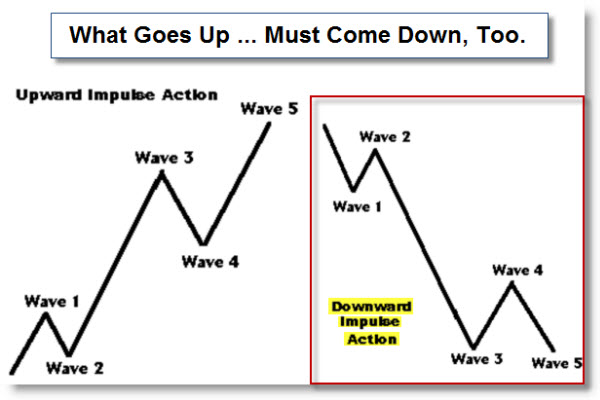
    Here is a chart that shows the basic sequence and an example of the sentiment causing the move.
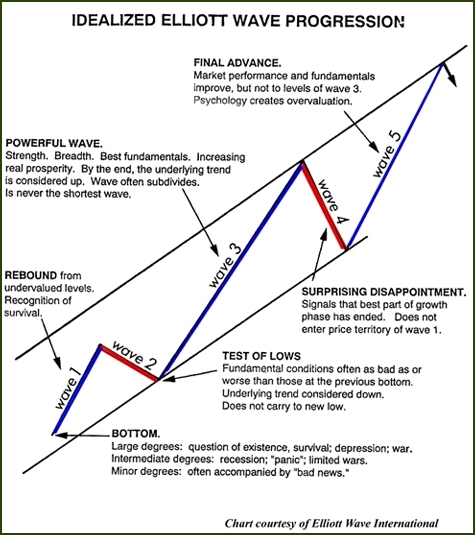
    090508 Idealized Elliott Wave Progression

    The next chart shows that a similar sequence often happens in both directions.

    090508 Elliott Wave Pattern Up and Down

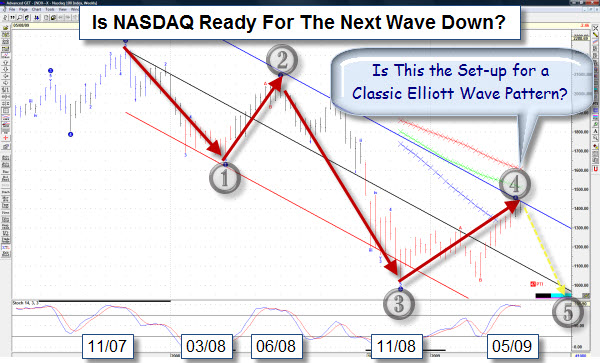
    All this reminded me that I have a piece of software called the Advanced GET, which uses a pretty clever algorithm for identifying some of the simpler Gann and Elliott Wave trading patterns. So I dusted-it-off, fired-it-up, and started playing around.

    Looking at a weekly chart of the NASDAQ, it's very easy to envision
    a five wave sequence as follows.

    090508 Elliott Wave Pattern on NASDAQ

    Note that the wave five target
    is beneath the recent lows. And that the wave four pullback takes us back to the top of the channel … and seems to have textbook Elliott Wave size,
    slope, and timing.

    Again, I don't trade
    the Elliott Wave. Yet it fascinates me, and is something
    that I do pay attention to as a framework.  Add to all this that the daily chart of the NASDAQ shows
    that price is stalled at its 200 day moving average, and I'm certainly going to be wary of a pull-back here.

    Business Posts Moving the Markets that I Found Interesting This Week:

    • Is The Recession Over? (Forbes)
    • Wall St Continues to Rally; S&P positive for '09. (Reuters)
    • Bernanke's Outlook A Bit Brighter, But Forecasts Slow Recovery. (WP)
    • The End Of The IPO Drought Is Coming. (A VC)
    • Venture Capital's Dilemma: the prescription for curing IPO ills. (Forbes)
    • Economic View – Depression Scares Are Hardly New. (NYT)
    • Feds Bailing Out States. (TDB)
    • More Posts Moving the Markets.

    Lighter Ideas and Fun Links that I Found Interesting This Week

    • The Science Of Concentration: Multi-Tasking Is A Myth. (NYT)
    • Amazon's Secret Weapon: Recommendations Based On Your Interests. (Forbes)
    • Coldplay Plagiarism Claims Filed By Three Artists (PopEater)
    • Funny Video – Real Life Twitter (E-Guiders)
    • Microsoft's Ozzie On Web Strategy & the Next Big Thing In Tech. (Forbes)
    • Shorter URLs Provide Real Value and Make Tracking Easier (NYTimes)
    • Publishers Nurture Rivals To Kindle (WSJ)
    • More Posts with Lighter Ideas and Fun Links.
  • Some Mother’s Day Thoughts

    Mothers Day SomeE-Card  To those of you with young children, here is a peek into your future.

    After years of hard work and your best efforts (OK, mostly your best efforts) … I predict that your adorable bundles of joy will someday wish they could send you this card.

    So, take a moment to think about your Mom … and remember that she was very young when she did those things to you …

    … and what you make them mean is up to you.

  • Capitalogix Commentary 05/01/09

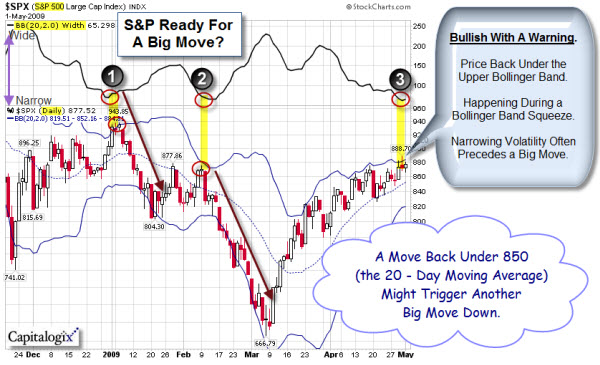
    "Sell in May and Go Away" is a popular market aphorism.  Still, the markets continue to hold up well despite less than favorable news.  Usually I consider that a bullish sign.

    This chart shows that the S&P 500 Index has dropped dramatically the past two times it rose above its upper Bollinger Band line (indicating a market high), while the Bollinger Band Width was narrow (indicating low volatility).  Well that is where we are again, and with low volume as well. 

    090501 SP500 BB Squeeze

    I am watching the 20 day moving average (which also serves as the recent up-move's trend line).  A break below that might trigger another big move down).

    This Week's Featured Market Chart.

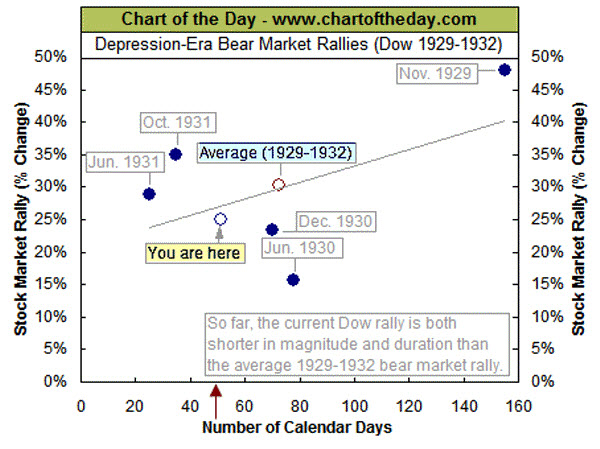
    Many investors have looked at the early 1930s for some insight into the current economic/stock market environment. While there are significant differences in the global economy and political landscape between the current environment and that what occurred in the early 1930s, there are also many similarities (bank failures, bankruptcies, severe market declines, etc.).

    For
    some perspective on the current stock market rally that began on March
    9th, the chart below illustrates the duration (calendar days) and
    magnitude (percent gain) of all significant Dow rallies that occurred
    during the 1929-1932 bear market (solid blue dots). For example, the
    bear market rally that began in October 1931 lasted 35 calendar days
    and resulted in a gain of 35%. As this chart illustrates, the current
    Dow rally (hollow blue dot with the pale yellow "You are here" label)
    is slightly below average in both duration and magnitude relative to
    the average 1929-1932 bear market rally (hollow red dot, with the pale
    blue label).

    090501 Chart of the Day Bear Rally Comparison

    So, as big as this rally seems … It still might be a bear market rally.

    What's Happening In the Legal Industry Says A Lot About the Market.

    I
    used to be a lawyer, and still have a number of friends who practice
    law. I don't normally use law firm data as a trading indicator; but
    these are not normal times.  I suspect that there are a number of early
    indicators we can glean from watching this industry sector.

    090501 Bankruptcy Law is Hot First,
    this weekend a bankruptcy partner in a large Dallas firm told me that
    he is seeing a big upswing in business. This implies a big increase in
    the number of bankruptcies to be filed in the coming months. I'm
    hearing similar things from friends around the country; that right now,
    the hottest section in many law firms is its bankruptcy practice.

    I
    think that means that the economy hasn't fully digested the damage done
    by the economic slow-down.  Frankly, I'd be surprised if it had.

    The
    other side of that coin is that law firms are downsizing and laying-off
    people because there simply isn't as much transactional work as there
    used to be.  The big example here is that Skadden Arps offered its associates one-third of their pay to take the year off.

    At
    Skadden, I'm sure many of them thought, nice work if you can get it. 
    However, I also suspect that a lot of talent will jump ship to
    corporate jobs.

    This might be the economic season that lawyers
    start to pursue other business interests.  Historically that has often
    been a positive mutation for businesses.  Research shows that a
    disproportionate number of corporate executives have legal degrees. 
    So, I'm looking for more lawyers to join start-ups roll-ups during the
    next downturn.  And I'll take that as an early indicator of recovery.

    When
    legal transactional work starts picking-up again because of mergers and
    acquisitions … I'll take that as an even better indicator that the
    recovery underway.

    Business Posts Moving the Markets that I Found Interesting This Week:

    • Stocks End Higher As Fed Sees Recession Easing. (AP)
    • Only 37% of WSJ Readers Said They Think The Economy Is Improving. (Forums)
    • Semiconductor Sales Fall 30%, Continuing Sharpest Downturn In Years. (WSJ)
    • In Major Shift, Apple Builds Its Own Team to Design Chips. (WSJ)
    • Starbucks Reports Steep Earnings Decline. (NYTimes)
    • Microsoft and Verizon in Talks to Launch iPhone Rival. (WSJ)
    • More Posts Moving the Markets.

    Lighter Ideas and Fun Links that I Found Interesting This Week

  • Capitalogix Commentary 04/24/09

    How much is a Trillion? If you were paid a dollar per second, it would take you 31,709 years to earn a Trillion dollars.

    If you are more graphic,

    How Much is Trillion 600p

    this link will show you how much it is in more detail.

    To put things in perspective, now think about Bailout … or that the IMF released its Global Financial Stability Report this week; and it's projecting total losses from the global financial crisis to reach $4.1 Trillion.

    This Week's Market Charts.

    The Markets held up nicely after a sell-off early last week.  Technology is still leading and the Dow has been lagging a little.  Other things nagging at me about the rally is that momentum is fading and volume hasn't been great.  Here is a chart showing how the Dow is positioned at key support and resistance levels.

    090424 Dow at Key Level

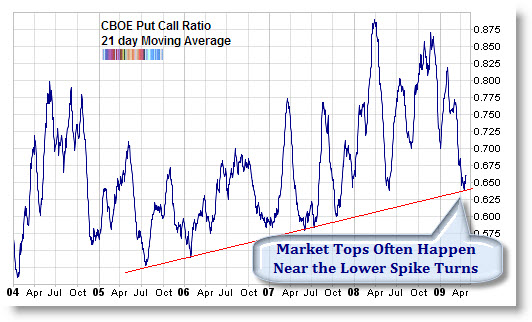
    Trader's Narrative had a chart that caught my eye. It shows that the short term moving average of the CBOE (equity only) Put-Call ratio is still quite low, corresponding to market tops. Adjusting for the upward sloping range of the data we find it at a similar level to October 2007.

    0904 5 Years of CBOE Put-Call Ratio

    Business Posts Moving the Markets that I Found Interesting This Week:

    • Microsoft Disappoints A day after Apple Didn't. (BW)
    • Amazon Net Jumps 24%, Resisting Recession (WSJ)
    • Hope, Greed and Fear: The Psychology Behind the Financial Crisis (Wharton)
    • An interactive map of vanishing employment across the country.(Slate)
    • Second Market: A New Form of Public Offering Is Emerging (A VC)
    • More Posts Moving the Markets.

    Lighter Ideas and Fun Links that I Found Interesting This Week

  • Capitalogix Commentary 04/17/09

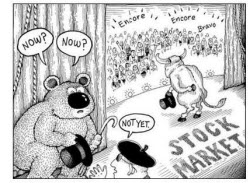
    090417 Bear in the Wings Stocks continued their advance this week.  The U.S. Markets moved higher for the sixth week in a row. Yet, it was just the seventh positive week for those indices in 2009. 

    It is worth noting that the bulk of earnings begin to hit this week. We'll see if people continue to buy into bad news. I'm watching for a change in sentiment.

    Long-Term Market Reminder: We have been in a bear market.  So, until proven otherwise, basic trend-following theory implies that the higher probability trades will be on the short side.  That means selling rallies until the bear market ends.

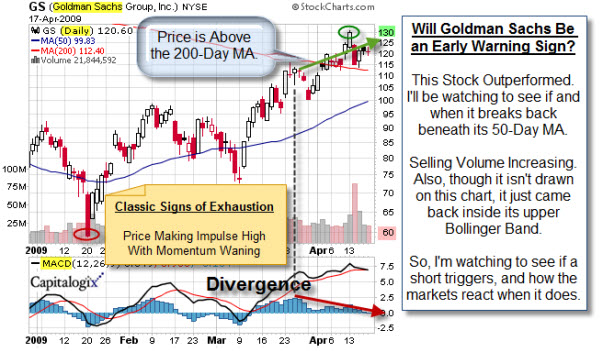
    I sense a renewed interest in the market recently by retail investors. For example, just this week I had conversations with several people telling me that they regret not buying Apple and Goldman Sachs while they were down.  I tend to hear this type of conversation at tops.  Here is Goldman's chart.

    090417 GS Topping

    It is also worth noting that there are reports that Goldman's Q1 Profit was non-recurring and a result of AIG unwinds. Add that to the fact that there we have seen poor bank earnings so far. Yet, it seems that the market sees a much higher likelihood of future financial solvency than it did just two months ago.  Still, this is a sector I'm watching for signs of weakness.  The next chart will explain why.

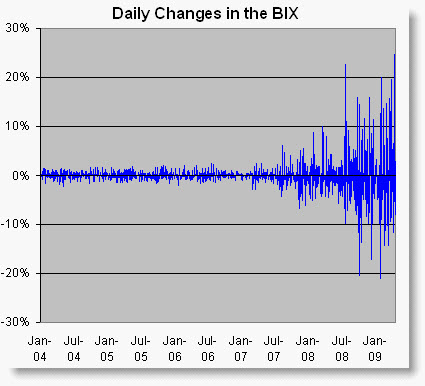
    Here is an interesting chart related to banks from Crossing Wall Street. It could be titled "The Earthquake That's Shaking Our Markets".  It shows recent volatility of Banking Index.

    090417 Daily Change in Banking Index Since 2004

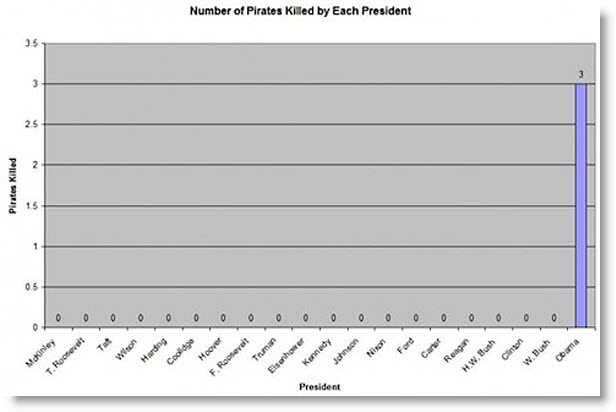
    Finally, I thought this was funny. Our peaceful pacifist president has become Obama The Pirate Killer.  Yeah, I know, the SEALs did it … But I like the chart anyway.

    090417 Obama The Pirate Killer

    Business Posts Moving the Markets that I Found Interesting This Week:

    Lighter Ideas and Fun Links that I Found Interesting This Week