Current Affairs

  • Weekly Commentary through October 31st, 2008

    Inancial+Problems boy with sign 200p
    October was the worst month for the S&P 500 since October 1987.  The current bear market, which made its most recent low this past Monday,
    is now the fourth longest decline in the S&P 500 without a 20%
    rally (on a closing basis). Besides the 1973/1974 bear market, the only
    other times this has occurred was during the 1929-era Depression.

    But that doesn't tell the whole story. It was a month that witnessed the second worst week ever, as well as one of the best.  It had two days where the S&P 500 was up more than 10%; along with one of the market's worst ten days ever too.  To sum it all up, "Volatility" was the word of the month.

    In terms of daily moves, the S&P 500 had only three trading days in October where the one-day change was less than 1%. Looking back over the last 50 trading days, the average daily change in the S&P 500 has been a move of 3%.   Unfortunately for the bulls, most of those moves were down. Historically, the only period where the average daily move in the S&P 500 has been higher was during the Depression.

    The volatility affected traders significantly.  If you summed the intra-day zig-zags, the daily range has been much higher. This put many trading models into unseen territory.

    Barry Ritholtz put together a list showing just how bad October was.  I enjoyed it, and think it is worth the click; here is a link to that post on the Big Picture.
  • Staying Informed and Up-To-Date

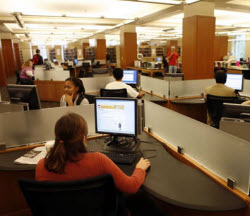
    Library Computers 250p
     Last week I went to visit my son, Ben, at a Duke University parents weekend. This April, I will return for my 25th reunion. A lot has changed since I was in college.

    One of the biggest changes I noticed was how much information the Internet puts at each person's fingertips, regardless of where they are on campus. Doing research no longer means a trip to the library. And books, magazines or newspapers are a distant second-place to online research and news items.

    Staying informed is a big part of my business as well. I used to receive several newspapers daily; and my morning routine started by scanning them cover-to-cover and clipping items that might be of interest to me are someone I knew. I rarely read a newspaper anymore, except when I'm on airplanes.

    Now, my daily routine uses news-feed readers and web sites to access a wide variety online content. This is a great way to sort, sift, filter, and act on relevant information.

    So, this week, I want to share some of the news sites that I find useful.

    News Aggregators:

    These
    are sites that combine news from many sources and create an updated
    mash up of information it gives me a quick view into what's happening
    each day.

    The Basics: There are no surprises here; still Google News and Yahoo! News are so good that I have to list them anyway.

    Next Generation: Some of the newer aggregation sites are quite clever.  Here are a few that I really enjoy:

    • NewsCred: Easily personalized to pick sources and rank by credibility.
    • Topix: Comprehensive and well categorized. Has a nice look and feel. Uses RSS well.
    • Newser: Nice summaries and related links. Uses pictures well, too.
    • Daylife: an example of an intelligent content service platform (read: little human editing).
    • Newsvine: well done; with social-sourced news flagging.
    • Regator: Specialty is organizing and finding blog posts.
    • Slate: A little different than the others; more editorial content.

    Slate Logo
    Slate has a number of interesting features.  Today's Papers summarizes current newspaper coverage.  Another summarizes current magazine stories.  And a third, called Today's Business Press, does just what you'd expect. 

    All three are quick to read and well done.

    Also worth checking: Digg, Technorati, and Techmeme.

  • Market Commentary from October 24th, 2008

    It has been another strong week for fear, greed and volatility.  Earnings season is here, and we are seeing large moves in both directions.

    There continues to be unprecedented global cooperation in the wake of the financial crisis.  The world seems to understand that it has to "snooze" the alarms until after the US election. The French have asked for a series of global summits to deal with the global financial crisis, with the first to begin after the U.S. election — and the last and most important to be held after inauguration day.

    Stratfor claims that this shows two things. The first is how flexible many international crises are. They can wait for changes in political leadership. The second is how important the United States remains. If the United States had lost its leadership role, French President Nicolas Sarkozy would not have gone to Washington to get the Americans to agree to a summit. The rest of the world could proceed by itself. Most likely, that isn’t going to happen. The Europeans and Asians meeting by themselves would not be in a position to make any decisions. For that, the Americans need to be there. And since the Americans won’t have a new leader until February, the world financial crisis will just have to wait until then. My point?  It would be prudent to expect fear, greed and volatility to continue.

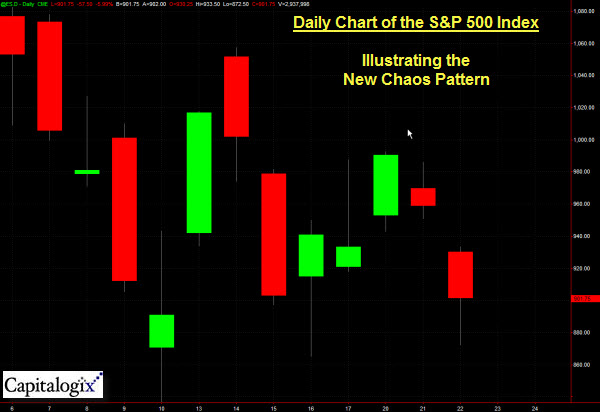
    Looking at this daily chart of markets for the past few weeks, I'm struck by this seeming randomness. It almost looks like there's no pattern.

    081022 ES Daily

    It is as if Jackson Pollock threw paint on our trading monitor and we mistook it for a chart. This utter lack of pattern might be an incredibly clear statement by the market. It says: "Danger, there is no edge here."

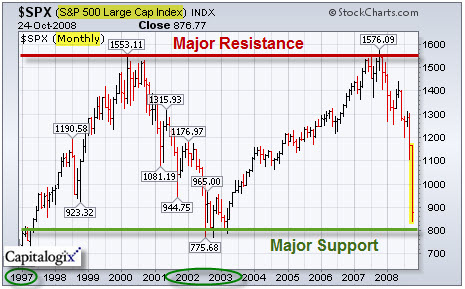
    The strange thing about markets, though, is that what doesn't make sense from one perspective – may make a lot of sense from another.  For example, here is a daily chart of the same S&P 500 Index, only showing a much longer window of time.

    081024 SPX Support and Resistance

    Hopefully that long-term support line (just below 800) holds.

  • Election Tools

    With the election coming in less than two weeks, I wanted to share some of the election websites that I check for updated information about how the race is going.

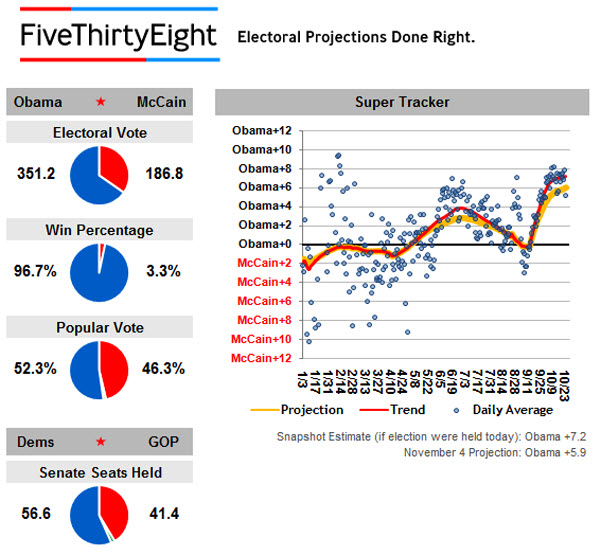
    The first website (called Five-Thirty-Eight.com) is graphically compelling, contains lots of updated information, and is done by someone whose primary job is communicating statistical information. The name comes from the number of electoral votes.

    081024 538 Electoral Projections 600p

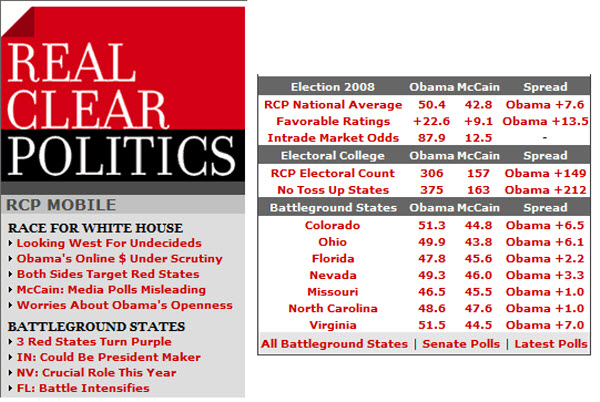
    The second website (called Real Clear Politics) has a lot more news, and I like the summary showing how much of a lead each candidate has in contested states. Here's an example of that chart.

    081024 Real Clear Politics 600p

    And, here is a link to the top-10 election tools on the web.

  • Weekly Commentary through October 17th, 2008

    The markets gained some ground this week, at least from a point perspective. It's so tempting to want to believe that the worst is over because of some of the rallies we've seen since late last week.

    It is possible that last week marked a major bottom. However the market is certainly not trading normally. So I'm not convinced.  The volatility we're seeing is unprecedented.

    Just this past week we had days with 10% – 15% swings inside the day. In fact, over the past 10 days the Dow had intraday swings of almost 85% of its total point value. We also saw the largest single day loss in the
    S&P ever (9%) as well as one of the biggest gaining days ever. My point is simple, fear and greed are still operating in extreme levels.

    Stress Metaphor and the Markets:

    A lecturer, when explaining stress management to an audience, raised a glass of water and asked 'How heavy is this glass of water?' Answers called out ranged from 8 to 20 ounces. The lecturer replied, 'The absolute weight doesn't matter. It depends on how long you try to hold it.

    'If I hold it for a minute, that's not a problem.
    'If I hold it for an hour, I'll have an ache in my right arm.
    'If I hold it for a day, you'll have to call an ambulance.

    'In each case, it's the same weight; but the longer I hold it, the heavier it becomes.'

    He continued, 'And that's the way it is with stress management. If we carry our burdens all the time, sooner or later, as the burden becomes increasingly heavy, we won't be able to carry on.'

    'As with the glass of water, you have to put it down for a while and rest before holding it again. When we're refreshed, we can carry on with the burden.

    How does this apply to the stress and the volatility hanging over the heads of market participants? The potential recovery is in a fragile state simply because people are stressed and tired; and I don't think it won't take much to trigger another bout of fear and greed.