Current Affairs

  • Capitalogix Commentary on the Markets 11/21/08

    The market is weak right now.  How do I know?  Aside from the near-audible moan of the world's collective unconscious, price going down is a pretty good primary indicator.  Kidding aside, other indicators are worth looking at here too.  One of them is the NYSE High-Low line. 

    The following chart shows this market breadth indicator.  It is calculated at
    the end of each day by taking the number of NYSE stocks making New 52-week
    Highs and subtracting the number of stocks making New
    52-week Lows. What is important to notice is the shape of the line – up is strong (or
    bullish), down is weak (or bearish).  Sometimes a picture is worth a
    thousand words. 

    081119 NYSE New Highs - New Lows

    You can view updated versions of this chart anytime on StockCharts.com at this link.

    Advice For the Markets: Stop It!

    So, what should the markets do next?  At this point, humor seems appropriate. I saw this clip of Bob Newhart from Mad TV, last week, and it made me laugh.

    Sometimes laughter is the best medicine.

  • Weekly Commentary through November 15th, 2008

    This was a big week for questions (and not so much for answers).  The Market is good at that.

    For example, did we just witness another successful retest of recent market lows, or are we just at the bottom again? 

    Are you surprised that GM's share price is at lows not seen since 1943?  If not, were you surprised they wanted in on the Bail-out too?  How surprised were you that the Bail-out isn't proceeding as planned?  Do you wonder whether Depression Economics is returning? 

    Many people believe that the finance sector is an early indicator for the market in general. This was a tough week for finance sector stocks. Yet, many stocks in that sector made spike bottoms.  This is something I am watching.

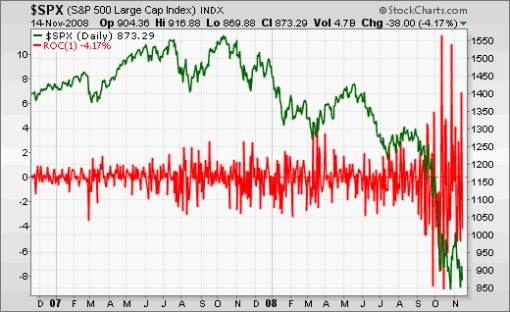
    Still, volatility remains high, and I take that as a sign of bear markets.  In the chart below, which shows the S&P 500 Index, the green line represents the index itself; and the red line shows the daily percent change in that Index, illustrating how volatility has increased recently.

    081115 SP500 Volatility High

    (via Investment Postcards)

    The Cloud Hanging Over the Markets:

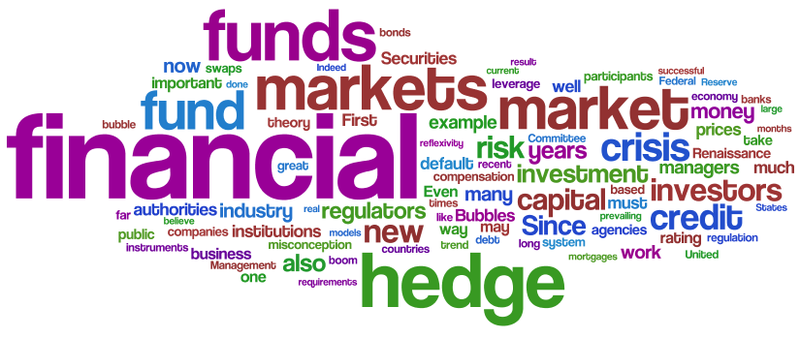
    People look for scapegoats During market troughs.  One of the first places they are looking now is the hedge fund industry.  What follows is a Wordle "word cloud" created from the text of the Congressional hearings held last week.

    Hedge fund congressional hearings -text cloud

    I loaded the text of the hearings to the site; so, Click this link to play with this Word Cloud.

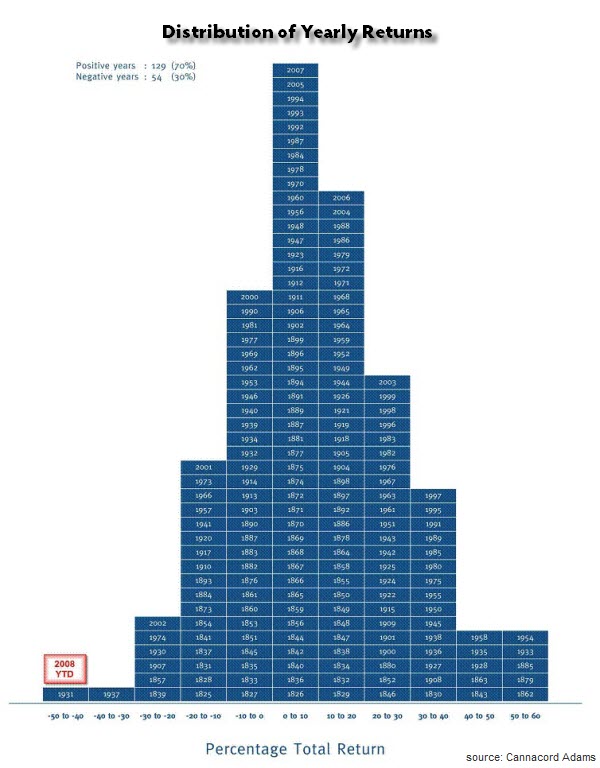
    Ultimately, the markets are having a tough time world-wide.  If you are standing in the rain, you are going to get wet.  Well, it rained a lot this year.  Take a look at this chart that shows the distribution of yearly returns in the US.  Hint: look at the bottom left of the graphic to find this year.Return Distribution from Canaccord 600p

    (hat-tip to Howard Lindzon)

    With markets performing so poorly here, and world-wide, It is not surprising that the demand for gold is rising in China or Saudi Arabia.

  • Weekly Commentary through November 7th, 2008

    Who (Or What) Really Controls the Markets? 

    Watching the 500-point down day following Obama's election,
    it would be easy to attribute the move to a reaction to the vote.  However,
    virtually every market
    around the globe suffered the same fate.

    When I first started trading I used to say things like, "I wonder what
    they're going to do in the morning?"  Or, "Wow, they are really trying
    to mess with people."  The point is that I anthropomorphized the market.  In
    other words, I made the Market seem like a person or a group of people
    with consciousness and intent.   

    It's easy to imagine a
    secretive group controlling things behind the scenes.  Maybe it's a
    select committee from the top investment banks.  And of course, you've
    heard of the "Plunge Protection Team", who supposedly steps in from
    time-to-time, "pressing buttons" and causing markets to dance their
    dance.

    As appealing as it is to believe that there's so much
    order and control underneath our markets, the fact that there's been so
    much correlation around the world, both to the downside and the upside,
    tells me that what is more likely in control is the fear and greed of
    the market's collective participants.

    Why is There So Much Fear? 

    Goldman Sachs forecast
    the deepest U.S. recession since the Reagan era after the unemployment
    rate climbed to the highest level in 14 years and payrolls tumbled for
    a 10th consecutive month. Ultimately, the economy has lost 1.2 million
    jobs since December, with over half of those losses in the last three
    months as the problems from the recession accelerate.

    On a related note, according to the WSJ, Goldman Sachs is approaching the share price it went public close to a decade ago. 

    081107 Japan at 26 Year Low
    While US equities market has been down recently, international markets had it worse. The fact that China just announced a 4 trillion Yuan ($586 billion) stimulus package — equivalent to nearly one-fifth of 2007 GDP
    — underlines how nervous Beijing is at the speed of its economic
    slowdown.

    And in Japan, the Nikkei hit a 26-year low a week ago (click to view chart). Forget about the lost decade, in Japan it has been the lost quarter century.

    The
    Nikkei has lost more than 20% of its value in the last month and is
    down by more than 40% for the year, capped by a 9.6% one-day loss a
    week ago. That put it lower than it was back in October 1982. 

    Yes,
    they have yo-yos in Japan too.  The Nikkei rallied 33% in 6 days this
    week, only to tank again.  As you can see, it is a small world.

  • “Now” Widget

    I saw this and spent some time watching the items change. 

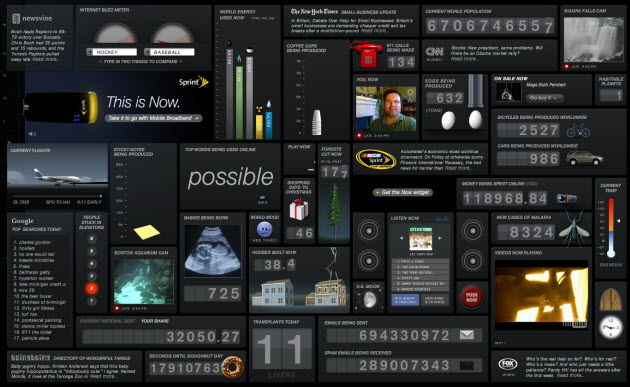
    It's got lots of
    tickers and content that change as you watch.  You just weren't aware
    that you would enjoy knowing how many emails are being sent or spam
    emails being received.  There are also recent news updates from The New
    York Times, CNN, Newsvine, top Google searches of the day, and lots
    more.

    Here are some tidbits from the background audio patter.

    • "Welcome to Now," the computer says.
    • "How about a big bowl of Now?"
    • "Please keep your hands inside the moment."
    • "Your hair has grown 5 millionths of centimeter in the last second."
    • "It is Now in all timezones."

    Very clever and well-done.

    Below is a limited version.  The link to the complete version is below. 

    Click to play with the full widget.  Here is a screenshot of it – and, yes, that is me in the middle.

    081108 Now Widget Graphic 630p

  • Seemingly Endless Elections

    081107 Red or Blue Pill
    The election is finally over.

    Did you take the Red Pill or the Blue Pill?  No, not that blue pill.

    Regardless, it seemed to take forever.  Didn't it?

    Here is a political cartoon that sums it up well.
    Political Cartoon Election Lasting 4 Years

    from Boston Globe.

    Also, here is a skit from Saturday Night Live.  This provides an interesting commentary on how elections are changing.  John McCain appears live, the weekend before election day, and participates in what I took to be gallows humor.  Was it a Maverick move?

    Here is a link to a description of the jokes. (CSMonitor Blog)

    Since I indulging in a little election humor, here is one more that made me smile.

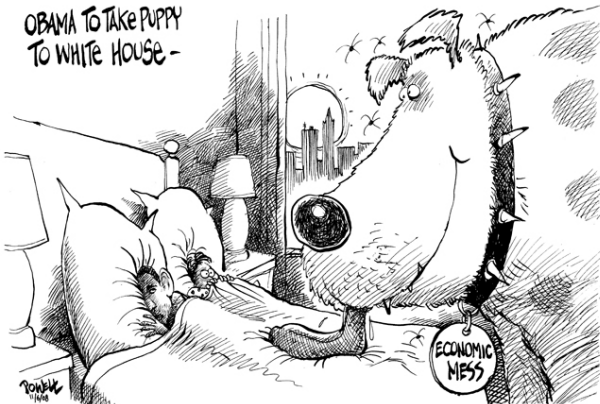
    081107 Obama's Puppy from USAToday