Current Affairs

  • Capitalogix Commentary on the Markets 12/19/08

    The Federal Reserve decided to drop their target Fed Funds rate to an all-time record of 0.00% to 0.25%.

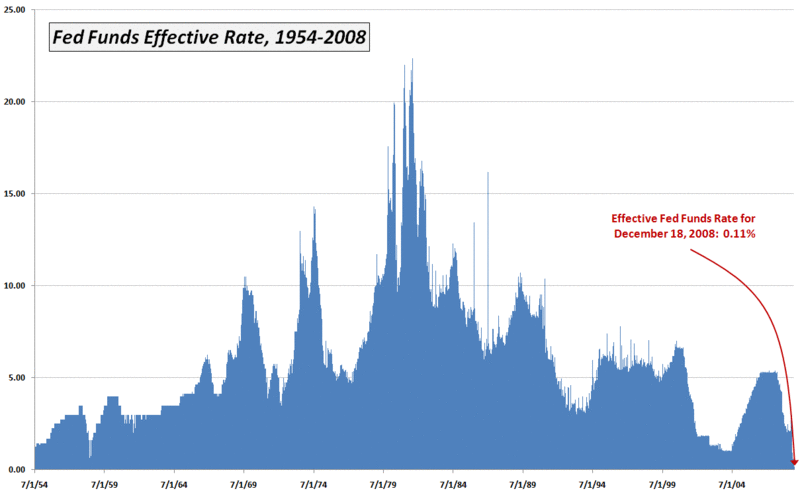
    This chart, from Bill Luby's Vix and More,  highlights the daily effective federal funds rate, which is a volume-weighted average of rates on trades arranged by major brokers.  It puts things in perspective, doesn't it?

    Fed Funds Effective Rates Since 1954

    Not surprisingly, last Friday’s effective Fed Funds rate of 0.11% is a record low.  In contrast, the record high of 22.36% dates back to July 22, 1981. The average Fed Funds rate since 1954 is 5.62%.

    People Are Less Scared.

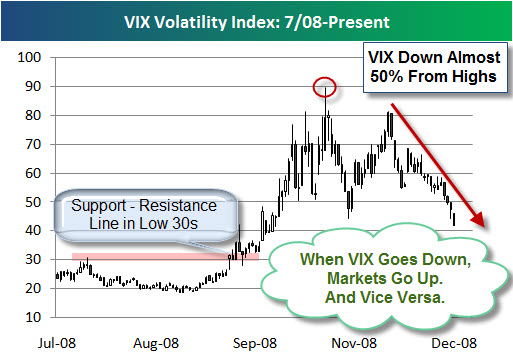
    Something else going down is the VIX, which is now down more than 50% from its highs.  The VIX looks out 30 days into the future and captures “event volatility” associated with events that are expected to occur in the next 30 days. These include Fed meetings, important economic data releases (employment report, consumer prices, retail sales, durable goods orders, GDP, etc.), earnings from bellwether stocks, even hurricanes, geopolitical crises and other events which can expect to cast a shadow over the course of the next 30 days.

    081219 VIX Down 50 Percent

    As shown above, the VIX recently broke below its November lows and is currently resting just above 40.

    The VIX typically goes up when the market goes down, but even on days when the market has declined this week, the VIX has gone down as well.  That means investors are feeling a lot less fear.

    What about the Government, though?  If they are so confident, why continue to print money?

    What's a Few Trillion Among Friends?

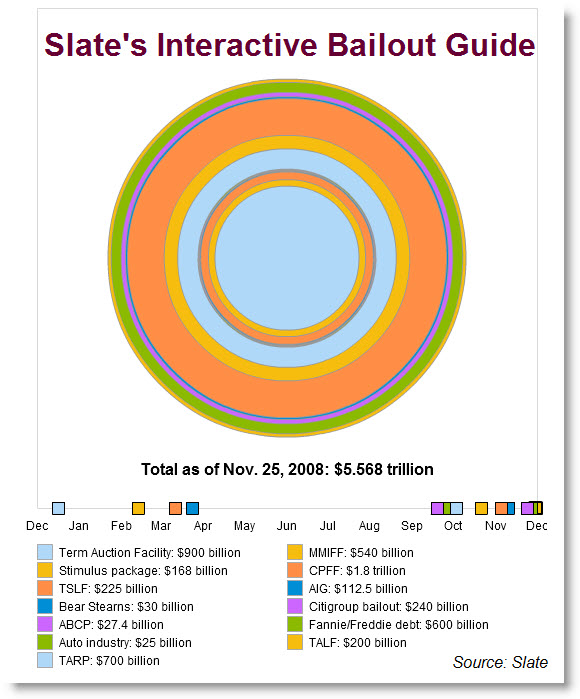
    Since the economic-stimulus package in February, the government has offered more than a dozen multibillion-dollar rescue packages for a variety of industries endangered by the financial chaos and the recession. The magnitude of even one of these mega-bailouts is hard enough to grasp. The following Slate visualization attempts to put the magnitude of these rescue packages in perspective.

    081219 Slate's Interactive Bailout Guide

    Here are a few other items that caught my eye this week.

    • Is it a Bail-Out or Smart Economics? (Dash of Insight)
    • Sy Harding Argues that Government Responses Will Limit Recession. (Financial Sense)
    • Money flow up sharply as S&P holds 50-day Moving Average. (Fallond)
    • Biggest 6-Day Decline Ever for the Dollar. (Bespoke)
  • Can A Beautiful Mind Create a Beautiful Face?

    Beauty Function 470p
    A team of scientists recently developed software that, using a carefully tested and proven understanding of facial proportion, greatly improves the attractiveness of your face without damaging your defining features or whether people will recognize that the picture is of you.

    Ever seen a picture of yourself that was a little too good? You’re still you, just a tiny bit better than the real-life you. That’s what this software supposedly does. 

    The inventor says this technology could become a product or web service where people upload their photographs and have them enhanced or beautified by the software. 

    So, if there was an “optimize portrait” button on Facebook, would a lot of people use it? Probably.

    Here is a short video.

    Here is a direct link to the video.

    Related Articles:

  • Capitalogix Commentary on the Markets 12/12/08

    Last Monday the news of the day seemed to be that the U.S. markets rallied because Obama committed to spend money on infrastructure.  I saw the same story on Bloomberg, CNBC, CNN, and pretty much everywhere I looked.  On the other hand, a quick check of the indices told me that most markets around the globe also were up between 4 and 10% that day.  Does that mean that Russia, Italy, and the Asian markets all rallied because Obama said that he was going to spend money on the U.S., or is it possible that some other catalyst caused markets to raise?

    The point is that the news gives many a false sense of certainty.  There is an old trading adage: It isn't the news that matters … What matters is the reaction to the news.  And recently I sense that people are getting tired of the choppiness and are starting to buy again, even on bad news.

    Bad News?  How about headline-making scandals?   First, the Governor of Illinois tried to sell his influence, and even the Senate seat vacated by President-Elect Obama. Second, Bernie Madoff, a former Chairman of NASDAQ, was arrested and charged with fraud in a $50 billion 'Ponzi-scheme' swindle of investors.  Third, we had the whole auto industry bail-out question.

    Still, markets went up, and somehow fear is subsiding.  Will we see a Santa Claus Rally?  From my perspective, a downside correction and successful re-test would be more constructive here.  So would better volume and less volatility.  But beggars can't be choosers; and we've had a 20% rally off the lows.

    Nature or Nurture

    After watching the Government bail-out financial companies, the auto industry seems to have learned a trick, or two. To me, this video represents a very real part of our economic ecosystem.  The swan has been conditioned to pull the rope to request a handout.  When nothing happens, the swan keeps ringing the bell … and is ultimately rewarded.  Question: is the swan trained, or did the swans train their handlers?

    The direct link to the video is here

    Also, here are a few other posts that caught my eye this week:

    • Henry Blodget on Why Wall Street Always Blows It (The Atlantic).
    • Are You Buying Now That Blood Is In the Streets?  Some Scary Predictions (Fortune).
    • Human Interest Twist to the Recent Financial Crisis in "Profiles in Panic" (Vanity Fair).
  • Capitalogix Commentary on the Markets 12/05/08

    There was good and bad news in the market this week. The bad news was that the economy continued to suffer (for example, the worst job loss numbers in decades), and the good news was that the market went up anyway. In contrast to recent reactions, that's very good news. 

    Something about the tempo of the market may have changed this week too. There were still a few big fast moves, however there were also longer periods of more natural trading.

    I'm not saying that the bear market is over. It will probably take a lot more than this to have a meaningful long-term bottom. Nonetheless, we may have a nice intermediate term support area in place, and the possibility for a decent rally from here.

    Running robot with charts

    The Migration to Automated Trading:

    For many years I was a discretionary trader.  That means I decided what
    to buy and what to sell using the tools I thought gave me the best edge
    for that trade.  Over time I relied more on technical analysis.  And,
    now, my trading is done by automated systems. 

    The use of so many
    different algorithms provides an interesting perspective on the rhythm
    of market.

    For years, market charts reflected the collective fear and greed of market participants.  Likewise, the patterns from one generation are not much different than the patterns from a different generation of traders; not because the world hadn't changed, but because human nature hadn't changed.

    People still traded with people.  When prices got too high, a certain percentage of people decided to sell.  When prices started to go down, some people got fearful – and as prices continued to go down, other people got greedy and decide to buy.  In other words, human nature is human nature; and while the magnitude of the moves may change a little, the basic pattern, the shapes and the slopes probably have remained relatively consistent for millennia.

    The Markets Are Changing:

    Now, however, something different is beginning to happen.  A greater percentage of the daily trading volume results from computer trading and automated models.  Consequently, more trades are happening outside the influence of fear and greed.  This means that the shapes and the basic nature of trading patterns are bound to change.

    It is early in this cycle.  Think about the Internet in the early 1990s.  Looking back, it all makes sense.  Yet in 1995, did you imagine this (how radically research, media, information delivery, media, and commerce would change)?  The game is changing.  Investing will never be the same again.

  • Capitalogix Commentary on the Markets 11/28/08

    Will Consumers Be Naughty or Nice This Holiday Season?  There was a lot of commentary on the start of holiday season sales this week.  The WSJ notes that bargain-hunters turned out in force for the "Black Friday" pre-dawn store openings and sales, but the annual frenzy was tempered by cautious buying amid the economic downturn. American consumers say they are less interested in consuming than at any other time in the past four decades. Still, the tone has been cautiously optimistic, so far, with the belief that more shopping is will shift online, even though online sales for the first three weeks of November are down 4% from last year.  In a related article, the NYTimes suggests that TV sales are becoming the litmus test for U.S. economy, and offers a glimpse of the
    broader tensions between cautious consumers and desperate retailers.

    Still, the Market has gained 21% since its low made five trading days ago (when the S&P 500 hit a new low for this bear market and touched levels last seen in 1997).  Many attribute this week's rally to some significant Government actions, such as:

    The Most Volatile Market Ever.

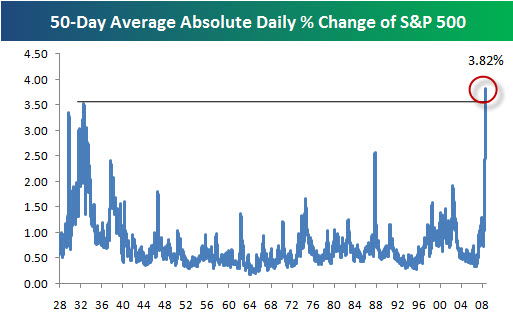
    According to Bespoke, over the last 50 trading days, the average absolute daily percentage change of the S&P 500 has been 3.82%!  That means the S&P 500 is averaging a daily move of up or down nearly 4%.  This is definitely one of the craziest (yet most telling) statistics of the current bear market, and unfortunately, the majority of the daily moves have been down.  In the history of the S&P 500, there has never been a more volatile period.  The closest other period was in the early 1930s.  In contrast, back in February of last year, the 50-day average absolute change was just 0.33%.  Here is a chart that illustrates the spike in volatility.

    SP500 Volatility Highest Ever

    What about Sentiment?  Well, the CBOE Volatility Index (VIX) has moved beneath its 50-day moving average for the first time in almost three months. Given the inverse relationship between the VIX and stocks, some read this as a bullish sign.

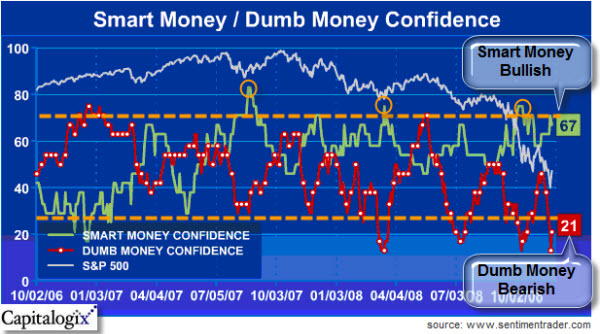
    SentimenTrader's Smart-Dumb Money indicator.  The Markets may still have some room to downside.  Yet, in contrast to the bearish bets made by small traders, recent Commitments of Traders reports (and other indicators) show that large commercial hedgers (aka the "Smart Money") are quite bullish. 

    081124 Sentimentrader Smart-Dumb Money Index

    Historically, a confidence spread this wide only happens once or twice a year.  Nonetheless, this is the fourth time we had such a sentiment spread this year.  In practice, the Confidence Indexes rarely get below 30% or above 70%.  Usually, they stay between 40% and 60%.  When they move outside of those bands, it's time to pay attention. The chart above shows that substantial bullish reversals often happen when this occurs.

    What Does This Say About the Spirit of Our Times?  This may not be market commentary but it might show the zeitgeist of the business climate.  McDonald’s wants to patent how it makes a hot sandwich.  I guess that is the other side of the coin from when McDonald's got sued by someone who got burned when they spilled a 49-cent cup of coffee in their own lap.