Current Affairs

  • Capitalogix Commentary 09/13/10 – Pavlov’s Banker

    President Obama promised to roll-out “new ideas” to boost growth and spur hiring during an economy-focused trip to the Midwest. He says the economy is moving in “the right direction; we just have to speed it up.”

    Consequently, the President is asking Congress to help small businesses by passing legislation that includes $12 billion in tax breaks and $30 billion worth of aid to free up credit. The question, of course, is whether the White House can turn these ideas into a political reality.

    Seems to me I've seen this play a few times.

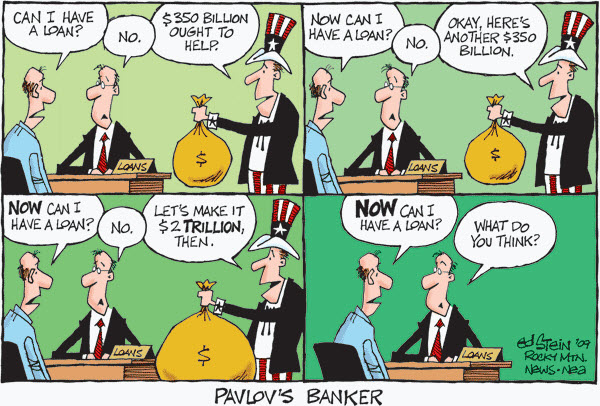
    100905 Pavlov's Banker - Stein

    Ed Stein reminds: "Every time these guys refuse to lend money, the government ponies up more billions. If it were me, I'd keep playing that game until the Treasury was empty, which apparently is exactly what the bankers are doing. There's a reason why they're rich."

    Market Commentary

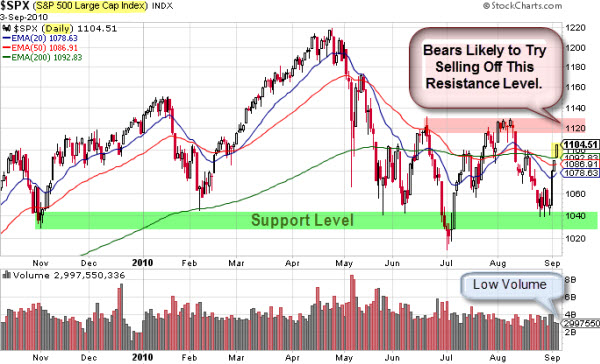
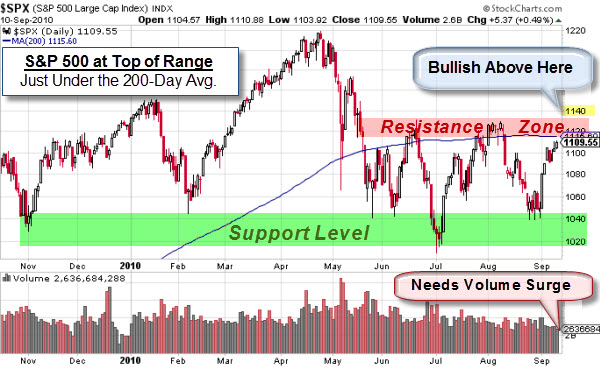
    The markets continued higher on light trading.  We are coming into the top of the consolidation zone.

    100911 SP500 Decision Zone

    There is not much to say, other than we are approaching a clear decision-zone.  A sustained move above the 1040 level will most likely trigger some real buying.

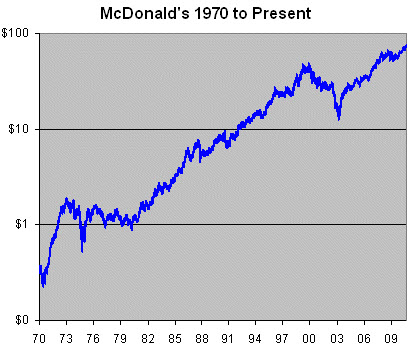
    Sign of the Times: McDonalds Hitting All-Time High.

    Here is something we haven't seen often lately, a stock hitting all-time highs.  Well, McDonalds recently hit $75.13 which is a long way from the $13 it hit in 2003.  Must be the special sauce?

    100911 McDonalds at All-Time High

    Successful Patterns.

    100913 elephant-tracks Why do patterns work? 

    Elephants leave tracks … and smart traders follow the big money.

    Large traders like governments, sovereign wealth funds, or a mutual fund can affect markets while they buy or sell; however, when they're done, some other group's strategy becomes the dominant force.

    It is important to understand "who is in control"  not necessarily why they are trading.

    That means you don't have to figure out every bit of information or rationale behind their strategy in order to make money.

    For example, if you were about to walk into a movie theater, but were suddenly confronted with hundreds of people running in the other direction screaming, you don't have to understand exactly why it's happening in order to respond intelligently.

    On a superficial level, that's the basis of trend following.  It is also an example of pattern recognition.

    You Can Find Patterns Everywhere.

    If you don't believe there is a consistent formula for success, then you should watch this collection of songs made-up from the same four chords.  The video is from an Australian Comedy group, called "Axis of Awesome".

    Quite clever.

    Business Posts Moving the Markets that I Found Interesting This Week:

    • Goldman's Hedge Fund Factory Closing Due to New Regulatory Limits? (MarketWatch)
    • U.S. Economy Slips to 4th in W.E.F.'s Competitiveness Rankings. So Who's #1? (ABC)
    • Beware of Greeks Bearing Bonds: Another Great Michael Lewis Piece. (VanityFair)
    • The Scariest Boring Phrase In Finance: "Sovereign Credit Spreads Are Widening". (NPR)
    • MBAs Are For Wusses: In Israel, Start-Ups Fight for Army Veterans. (Economist)
    • More Posts Moving the Markets.

    Lighter Ideas and Fun Links that I Found Interesting This Week

    • Putting Things in Perspective: The World's Oldest Living Things. (TED)
    • Breath Like the Rest of the World: Fresh Air for Sale in Hong Kong. (GreenBlog)
    • Army Yoga: Making Soldiers Fit to Fight Without the Situps. (NYTimes)
    • Re-Thinking American Options About Iran. (Stratfor)
    • Mate Selection: Identifying Which Dance Moves Make Men Attractive to Women. (Economist)
    • More Posts with Lighter Ideas and Fun Links.
    Enhanced by Zemanta

  • Capitalogix Commentary for the Week of 09/06/10

    The "invisible hand" is becoming replaced with a much more easily seen and felt version, and I suspect people are not only noticing … but adjusting.

    100904 Sheep-notices-man-and-dog-working-together

    At this point, I'm not sure if people (or the "market") want more or less intervention.  For example, The Financial Times reports that the Fed minutes released last week fueled recovery fears because the meeting notes raise questions about whether the Fed has ruled out large-scale asset purchases. (FT)

    Apparently, the powers-that-be still have some things in their bag-of-tricks.  Early last week I posted a Tweet saying that big market drops on low volume have been the trigger for Plunge Protection activity.  Not to disappoint, we got the requisite ramp-up.  The question is whether we'll get real follow-on buying?

    Market Commentary.

    Last week was technically stronger than I originally thought.  Why?  Because both the S&P 500 and Nasdaq indices moved above their 20-, 50- and 200-day exponential moving averages. That isn't a common technical happening. Getting through a single moving average often proves difficult; so getting through all three major moving averages at once is something worth noting.  Now let's see the reaction.

    100905 SP500 Decision Zone Levels

    The short-term average is below the mid-term average, which is still below the long-term average.  In English, that means we are probably still in a down-trend.  Consequently, I'll be watching the resistance zone market by the pink highlight. If bears mount a challenge to the recent push higher, that would be a likely spot for the reversal.  Otherwise, a break above that level could easily test the May highs.

    How Does Employment Effect the Outlook?

    It is a little ironic to talk about this on Labor Day weekend; nonetheless, we got more bad employment data last week.  The best I can say about it is that it wasn't met with selling. 

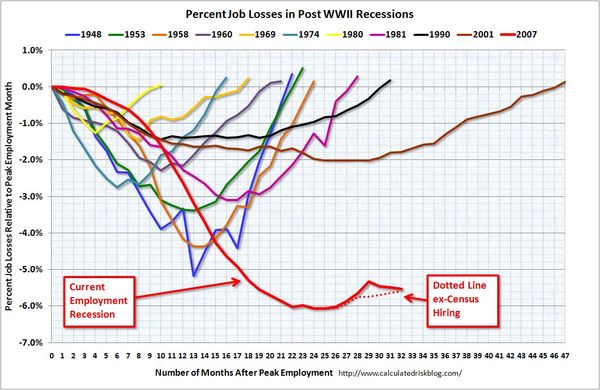
    First, we'll look at the percent of job losses during various recession.  The following chart shows that our current job situation stands out and speaks for itself.  This chart also highlights the effects of census hiring as well as the extremely weak hiring in this recovery. 

    The dotted lines tell the real story about how pathetic the jobs recovery has been so far. Bear in mind it has taken $$ Trillions in stimulus to produce this.

    100905 Employment Recessions
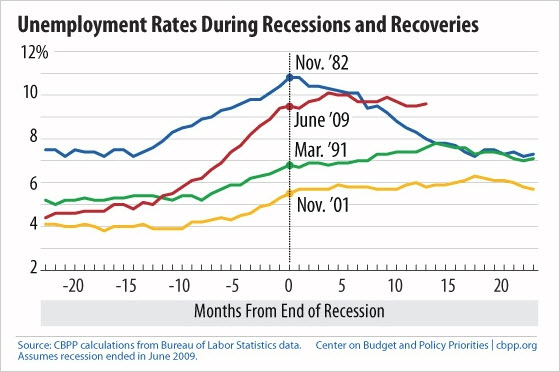
    Second, the chart below shows the unemployment rates during recessions and recoveries.  Notice that there has not been any recovery in the labor market.  Unemployment has actually deteriorated when compared to the end of past recessions.  

    100905 Unemployment Rates During Recessions and Recoveries

    According to the Pragmatic Capitalist, without a recovery in the labor markets, it’s impossible to say that the economy is rebounding.  As of now, the outlook remains negative.

    However, without sellers, that increasingly visible hand can continue to push the markets higher.  As summer (and slow trading) comes to an end, it will be interesting to see what happens next.

    Business Posts Moving the Markets that I Found Interesting This Week:

    • Another Example of How Nouriel Roubini Earned His "Dr. Doom" Title. (Atlantic)
    • The Rise of the PermaBears In the Face of Recessions & Ballooning Debts. (NYTimes)
    • Sign of the Times: Foreclosures of Million-Dollar-Plus Luxury Homes Rising. (LATimes)
    • Why Wall Street Is Deserting Obama. (Dealbook)
    • China’s Central Bank Chief Rumored To Have Defected (Forbes)
    • More Posts Moving the Markets

    Lighter Ideas and Fun Links that I Found Interesting This Week

    Enhanced by Zemanta

  • Capitalogix Commentary for the Week of 08/30/10

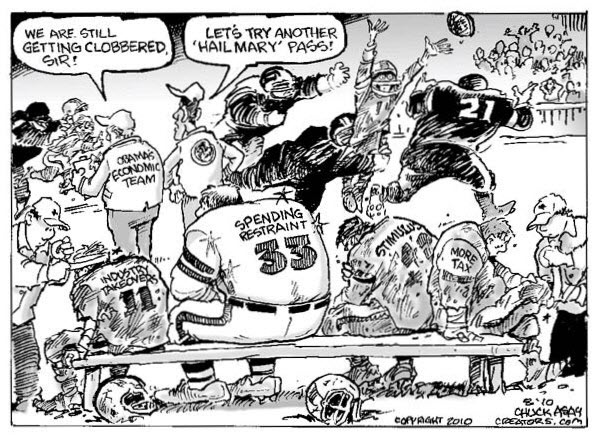
    The Fed had their annual meeting in Jackson Hole, Wyoming last week. On Friday Fed Chairman Bernanke announced that the Fed was ready to dig deeper and take bold actions if the economy continued to weaken. On cue, Intel announced lowered guidance and the Dow Jones Industrial Average was trading under its 10,000 level.

    100829 Hail Mary Time for the Economic Team
    However, traders say that it's not the news that matters, but rather it's the reaction to the news that matters. In case you didn't see it, the reaction was consistent buying for the rest of the day. Not only did the Dow get back above 10,000, but the markets also erased much of their losses for the week.

    Market Charts.

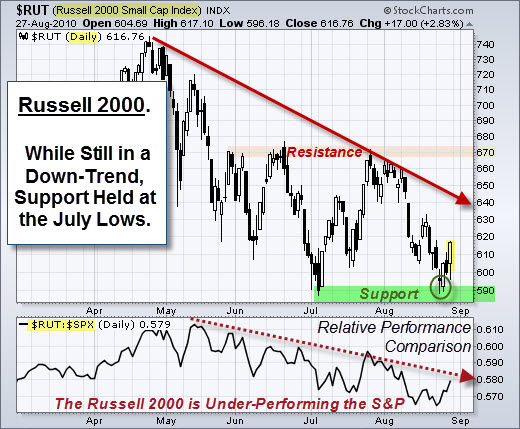
    Here is a daily chart of the Russell 2000 Small-Cap Index showing the downtrend it has been in since April. The good news is that support held at the July lows. That level is marked by the green highlight. Any move beneath that would be decidedly bearish. On the other hand, it is unlikely the Bulls would feel safe until price clears the resistance level marked by the pink highlight.

    100828 Russell 2000 Decision Levels
    Another thing to note in this chart is how dramatically the Russell 2000 Small-Cap Index had under-performed the broader S&P 500 Index since May.  It is usually a bearish sign for the market when small caps and technology stocks are under-performing — which is what they are doing presently.

    What is Happening with the Volatility Index?

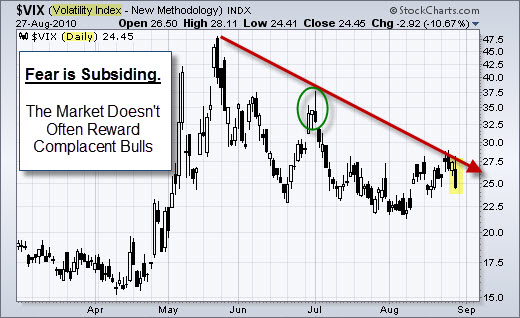
    While the markets retreated back near July lows, the Volatility Index (or VIX) did not show a spike of fear.  Many traders view the VIX as a contrary indicator, which means the lack of fear could be bearish.

    100829 VIX Showing Fear Subsiding

    How Has the Government Spent the Stimulus So Far?

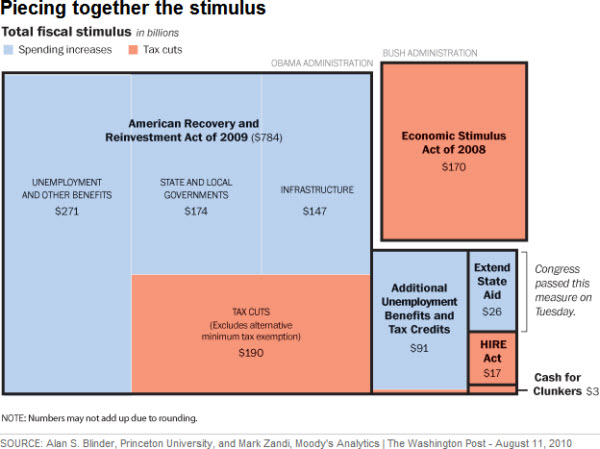
    Counting through the beginning of August, Congress has now approved over $1 trillion in spending and tax measures to stimulate the economy.  Here is a chart, put together by the Washington Post, which breaks down the spending.

    100829 Piecing Together the Stimulus So Far

    I wonder what that will look like next year?

    Business Posts Moving the Markets that I Found Interesting This Week:

    • Bear Market Math – Are the July Lows in Danger? (YFinance)
    • Does M&A Activity Predict Broad Stock Market Performance or Just Bank Profits? (SmartMoney)
    • Amazon Web Services About to Be a Billion Dollar Business On Its Own. (BusinessInsider)
    • Commitment or Folly: Microsoft's Online Efforts Lost $6 Billion in 8 Years. (ZDNet)
    • Is China's Economy Worse than it Seems? (Stratfor)

    Lighter Ideas and Fun Links that I Found Interesting This Week

    • How Sitting on the Toilet Messes With Your Health. (Slate)
    • The End of Management – Why Managers Should Act Like VCs. (WSJ)
    • Kids Text Every 10 Minutes When They're Awake – What About the Rest of Us? (BusinessInsider)
    • Google Adds Calls to Gmail – Big Warning Bells for Land-Lines and Skype. (WSJ)
    • China Has a Massive Traffic Jam Could Last For Weeks. (AsianCorrespondent)
    Enhanced by Zemanta

  • Have You Noticed that News is Becoming Info-Porn? Here is a Video Parody from the BBC: “How To Report The News”

    Have you noticed that news is becoming Info-Porn?   With multitudes of titles, it comes in many shapes and sizes — but you know it when you see it.

    Follow the formula and the content doesn't seem to matter.  It starts with a lackluster establishing shot, followed by a walking and talking preamble. Next various facts will pop on the screen as if you're watching a bad PowerPoint presentation …  We are exposed to a seemingly endless variety of sameness.

    For a funny take on this, watch Charlie Brooker's – How To Report The News from the BBC.  I thought this short video was well-done and quite clever.

    Have fun.

    Enhanced by Zemanta

  • Capitalogix Commentary for the Week of 08/23/10

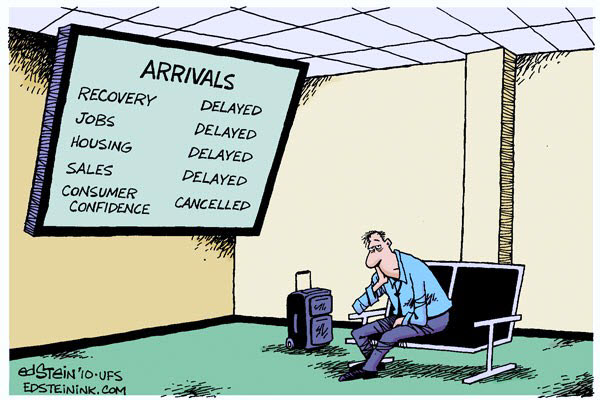
    We are in the dog-days of summer.  Perhaps it is a good time to travel, just so you are not tempted to watch the news.

    100821 Recovery Status Cartoon - Stein

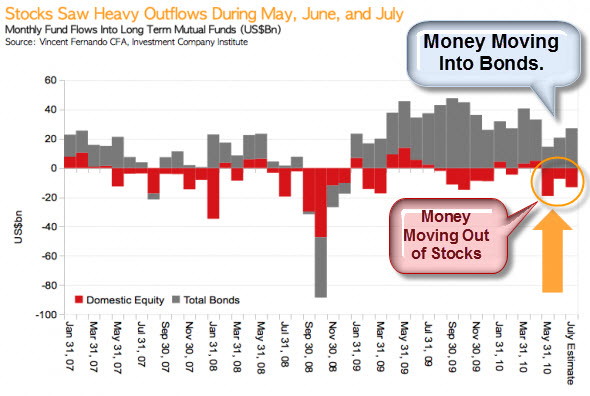
    Biggest Negative Fund Flow Out of U.S. Stocks Since During the Crisis.

    Money is flowing out of equity markets into the bond market.  According to the NYTimes, investors withdrew a staggering $33.12 billion from domestic stock market mutual funds so far this year.

    In the chart, below, the red bars represent fund flows for U.S. equity mutual funds, and the gray bars represent fund flows for bond mutual fund.  The data for this chart is based on the fund flow data of long term mutual funds tracked by the Investment Company Institute.

    100822 Money Moving Out of Stocks and Into Bonds

    Likewise, according to Rasmussen research, consumer & investor confidence has fallen to a 2010 low.

    The Consumer Metrics Institute's Growth Index.

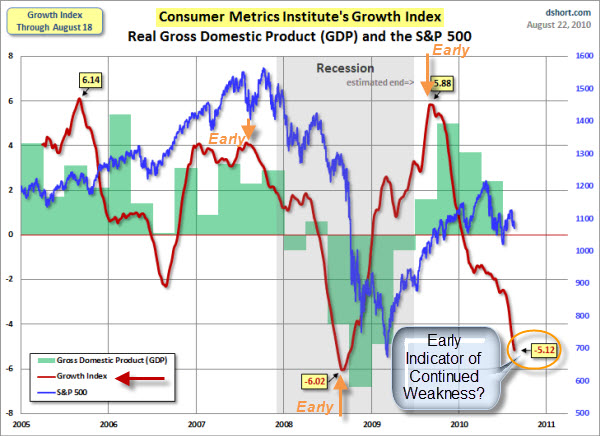
    It's easy to get distracted by other data, but (for the most part) price is the primary indicator to use when analyzing a stock chart. Of course, it's still useful to try and get an early indicator of how a well-followed metric may perform.

    The chart below shows three different data points. The S&P 500 index, GDP, and the Consumer Metrics Institute's Growth Index.  Historically, the Growth Index has given an early indication of what GDP and the stock market are likely to do soon after. So, its recent decline might be an early indicator of continued weakness.

    100822 Consumer Metrics Growth Index
    This is something that bears watching.  If you're interested, here's a link from dshort.com that covers this topic in more detail.

    As more people worry that our economy is not changing as hoped; some things are changing … technology and legislation.

    How Does Technology Change the Investment Landscape?

    Duncan Niederauer, NYSE Euronext CEO, sat down with Maria Bartiromo at the "Techonomy Conference" in Lake Tahoe to talk about technological advancements and what they mean for the future of trading.


    My guess is that we are going to see a whole new round of cries for regulation of financial technology.

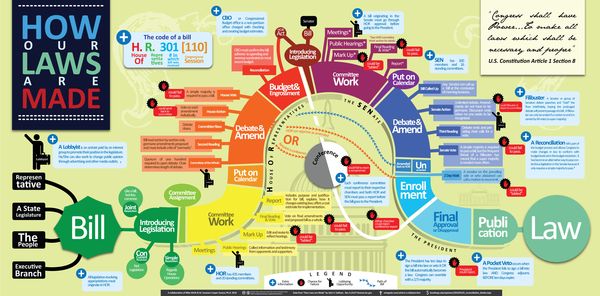
    Here is an Explanation of How Laws Are Made.

    For the past two years, Financial Reform has been in the news.  Here is is a link to a discussion of what it can accomplish. Now that the Dodd-Frank Bill has become law, I thought it might be helpful to show the path it had to take?  Here is an informative infographic put together by  Mike Wirth that lays out how a Bill becomes a Law.  Click the image to see a larger version.

    HowlawsmadeWIRTH2

    Business Posts Moving the Markets that I Found Interesting This Week:

    • Market Data Firm Spots the Tracks of Bizarre Robot Traders. (Atlantic)
    • Will the New Financial Reform Law Affect Big Bank Profits? (RollingStone)
    • Soros Flees Stocks, Yet Remains Bullish On 'The Ultimate Bubble' in Gold. (BI)
    • Rising Profits Are Good, But Sales Haven't Kept Pace. (NYTimes)
    • More M&A: Why Did Intel's Pay $7.68 Billion to Purchase of McAfee? (Newser)
    • Following Jobs Report, Consumer & Investor Confidence Falls to 2010 Low.
    • More Posts Moving the Markets.

    Lighter Ideas and Fun Links that I Found Interesting This Week:

    • Surprising Research on the Effect of Interruptions on Your Work. (BothSides)
    • 10 Amazing James Bond Gadgets That You Can Actually Buy. (BusinessInsider)
    • Big Brother is Watching: Judges Divided Over Growing GPS Surveillance. (NYTimes)
    • At Least It Wasn't Cancer: Doctors Find Pea Growing In Man's Lung. (NPR)
    • Class of 2014 Doesn't Know Cursive: Snapshot of a Generation. (Newser)
    • More Posts with Lighter Ideas and Fun Links.
    Enhanced by Zemanta

  • Capitalogix Commentary for the Week of 08/23/10

    We are in the dog-days of summer.  Perhaps it is a good time to travel, just so you are not tempted to watch the news.

    100821 Recovery Status Cartoon - Stein

    Biggest Negative Fund Flow Out of U.S. Stocks Since During the Crisis.

    Money is flowing out of equity markets into the bond market.  According to the NYTimes, investors withdrew a staggering $33.12 billion from domestic stock market mutual funds so far this year.

    In the chart, below, the red bars represent fund flows for U.S. equity mutual funds, and the gray bars represent fund flows for bond mutual fund.  The data for this chart is based on the fund flow data of long term mutual funds tracked by the Investment Company Institute.

    100822 Money Moving Out of Stocks and Into Bonds

    Likewise, according to Rasmussen research, consumer & investor confidence has fallen to a 2010 low.

    The Consumer Metrics Institute's Growth Index.

    It's easy to get distracted by other data, but (for the most part) price is the primary indicator to use when analyzing a stock chart. Of course, it's still useful to try and get an early indicator of how a well-followed metric may perform.

    The chart below shows three different data points. The S&P 500 index, GDP, and the Consumer Metrics Institute's Growth Index.  Historically, the Growth Index has given an early indication of what GDP and the stock market are likely to do soon after. So, its recent decline might be an early indicator of continued weakness.

    100822 Consumer Metrics Growth Index
    This is something that bears watching.  If you're interested, here's a link from dshort.com that covers this topic in more detail.

    As more people worry that our economy is not changing as hoped; some things are changing … technology and legislation.

    How Does Technology Change the Investment Landscape?

    Duncan Niederauer, NYSE Euronext CEO, sat down with Maria Bartiromo at the "Techonomy Conference" in Lake Tahoe to talk about technological advancements and what they mean for the future of trading.


    My guess is that we are going to see a whole new round of cries for regulation of financial technology.

    Here is an Explanation of How Laws Are Made.

    For the past two years, Financial Reform has been in the news.  Here is is a link to a discussion of what it can accomplish. Now that the Dodd-Frank Bill has become law, I thought it might be helpful to show the path it had to take?  Here is an informative infographic put together by  Mike Wirth that lays out how a Bill becomes a Law.  Click the image to see a larger version.

    HowlawsmadeWIRTH2

    Business Posts Moving the Markets that I Found Interesting This Week:

    • Market Data Firm Spots the Tracks of Bizarre Robot Traders. (Atlantic)
    • Will the New Financial Reform Law Affect Big Bank Profits? (RollingStone)
    • Soros Flees Stocks, Yet Remains Bullish On 'The Ultimate Bubble' in Gold. (BI)
    • Rising Profits Are Good, But Sales Haven't Kept Pace. (NYTimes)
    • More M&A: Why Did Intel's Pay $7.68 Billion to Purchase of McAfee? (Newser)
    • Following Jobs Report, Consumer & Investor Confidence Falls to 2010 Low.
    • More Posts Moving the Markets.

    Lighter Ideas and Fun Links that I Found Interesting This Week:

    • Surprising Research on the Effect of Interruptions on Your Work. (BothSides)
    • 10 Amazing James Bond Gadgets That You Can Actually Buy. (BusinessInsider)
    • Big Brother is Watching: Judges Divided Over Growing GPS Surveillance. (NYTimes)
    • At Least It Wasn't Cancer: Doctors Find Pea Growing In Man's Lung. (NPR)
    • Class of 2014 Doesn't Know Cursive: Snapshot of a Generation. (Newser)
    • More Posts with Lighter Ideas and Fun Links.
    Enhanced by Zemanta

  • Classic Photo: Misspelled “School” Zone Sign

    As kids gear-up to go back to school, here is photo showing that some people need it more than others.

    100814 Somebody Has to Go Back to School

    According to this story,  a road contractor hired to paint the word "school" on a freshly paved stretch of road near Southern Guilford High School in North Carolina rendered the traffic area in question a "shcool" zone.