admin

  • Here Are Some Links For Your Weekend Reading

    Not everything is new yet.

    You've seen kids trying to swipe restaurant menus like an iPad, only to be confused why it doesn't show them something else.

    Well, following the same logic, the slot in your car must be good for something; right?


    150906 iPhone Dock or Cassette Player


    In case you are curious … no, this doesn't work. 

    Here are some of the posts that caught my eye. Hope you find something interesting.


    Lighter Links:


    Trading Links:

  • Gartner’s 2015 Hype Cycle for Emerging Technologies Identifies the Computing Innovations Worth Monitoring

    Which are the most hyped technologies today? Check out Gartner's latest 2015 Hype Cycle Report, which illustrates the market excitement, maturity, and benefit of various technologies.


    What's the Hype Cycle about? 

    As technology advances, we tend to get over-excited about new buzz-words & trends in technology and then disappointed when expectations of results go down.

    This year, Autonomous Cars and the Internet of Things stay at the peak – while big data has matured past the hype stage. 

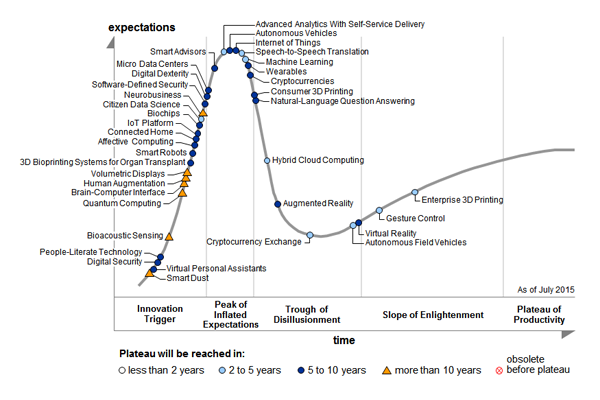
    Here is the chart.


    Figure 1. Hype Cycle for Emerging Technologies, 2015
    150906 Gartner 2015 Hype Cycle

    Source: Gartner (August 2015).

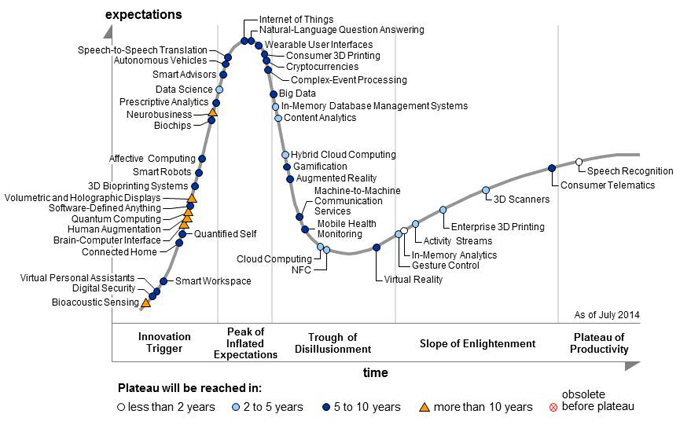
    For comparison, here is the chart from last year.

    Fig. 2: Hype Cycle for Emerging Technologies, 2014.
     

    150906 Gartner 2014 Hype Cycle

    Source: Gartner (August 2014).

     
    The hype cycle gives us an idea of which of these technologies survive the market hype and have a potential to become a part of our daily life. 

    Here are the five regions of Gartner's Hype cycle:

    1. Innovation Trigger (potential technology breakthrough kicks off),
    2. Peak of Inflated Expectations (Success stories through early publicity),
    3. Trough of Disillusionment (waning interest),
    4. Slope of Enlightenment (2nd & 3rd generation products appear), and
    5. Plateau of Productivity (Mainstream adoption starts). 

    Here are some of the key Big Data-related technologies:

    • Autonomous vehicles, their placement is shown to have shifted from pre-peak 2014 to peak 2015 of the Hype Cycle. According to Gartner, "while autonomous vehicles (like driverless cars) are still embryonic, this movement still represents a significant advancement, with all major automotive companies putting autonomous vehicles on their near-term roadmaps".
    • Internet of Things (Network of Intelligent objects around us coordinating activities) remains consistently almost at the Peak in both years. It is thought of as the most disruptive technology in decades – once widely deployed.
    • Natural Language Process Question Answering, last year’s winner, is on its slide down to the Trough. It is still questionable how quickly it will make it through.
    • Big data is nowhere to be seen in the 2015 hype cycle; whereas, last year, it was entering the trough of disillusionment. This may mean that the most talked about big data related technologies are now into practice … and are no more a 'hype'.
    • Machine Learning made its first appearance on the chart this year, but already past the peak of inflated expectations – and now takes the place of Big Data.
    • Digital Humanism, as Gartner defines – makes people better, not technology better.  Wearables and the Internet of Things are at the top of the "peak of inflated expectations" on the cycle, along with machine learning and advanced analytics. All those trends are expected to plateau in between two and five years.
    • Citizen Data Scientist: Gartner added this new class (in the innovation trigger region) and is expecting it to reach a plateau in 2-5 years.  Think of it as Data Scientist Lite, as businesses cultivate people who may have some data skills (possibly from a math or even social science degree) and put them to work exploring and analyzing data.
    • Enterprise 3D Printing and Gesture Control Technologies are heading for the plateau fast, but are currently placed in the "slope of enlightenment".
    • Digital Dexterity is new.  "Today's employees possess a greater degree of digital dexterity," said Matt Cain, research vice president at Gartner. "They operate their own wireless networks at home, attach and manage various devices, and use apps and Web services in almost every facet of their personal lives. Gartner has outlined several ways in which the IT organization should exploit employees' digital dexterity.
    • Data Security, which is aready a critical priority today, seems to be surprisingly less of a hype – and is shown as "Digital Security" in pre-peak and close to the trigger region of the hype cycle.
    • None of these technologies entered the plateau of productivity, unlike Speech Recognition last year. This may change in the upcoming years with more technologies growing mature.

    Which technologies do you think are over-hyped … and which ones might survive the hype?

    Additional information is available in Gartner's "Hype Cycle for Emerging Technologies, 2015." This report is part of Gartner's Hype Cycle Special Report for 2015. This Special Report provides strategists and planners with an assessment of the market hype, maturity, business benefit and future direction of more than 2,000 technologies, grouped into 112 areas.

  • Here is a Map Showing Countries Scaled Based on the Size of Their Stock Markets

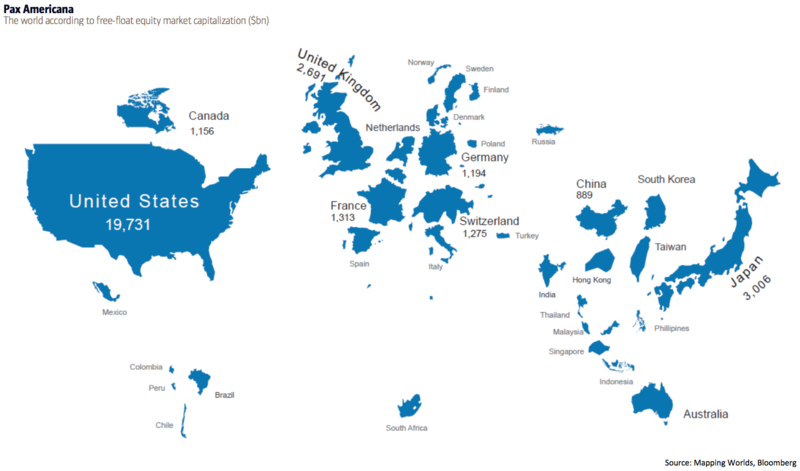
    There has been a lot of news lately about global markets … and how something that happens in one affects the others.

    This chart is interesting because it puts the world's markets in a different perspective.

    It shows the world according to free-float equity market capitalization in billions of dollars measured by the MSCI


    150906 Map Showing Countries Scaled to Equity Market Capitalization


    From BofAML’s Transforming World Atlas

    The US, with a market cap of $19.8 trillion, is the biggest and represents 52% of the world's market cap. Japan is in second place at $3 trillion, followed by the UK at $2.7 trillion, and then France at $1.3 trillion.

    Notably, Hong Kong's market cap is nearly the same size of China (both of which are significantly smaller than countries like the US and Japan). 

    Meanwhile, Russia, which has a bigger surface area than Pluto, is about the same size as Finland in terms of market cap.

    Interesting.

  • Putting This Market Decline in Perspective

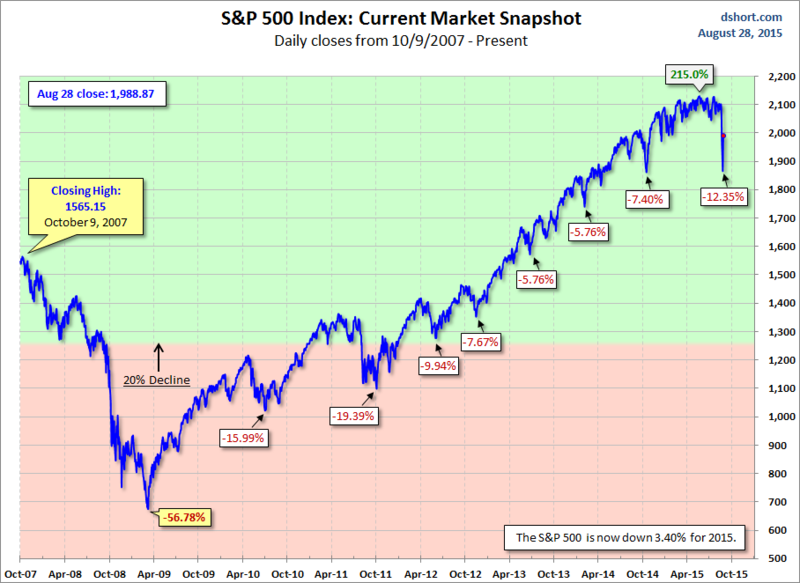
    How bad was the recent decline?  It was the biggest since 2011.

    To put it in better perspective, here is a chart (based on daily closes) showing significant S&P 500 Index declines since the all-time high prior to the 2008 Bear Market.

    The area with the pink background highlights the "Bear Market" area beyond the 20% decline mark.


    150828 SPX Snapshot Showing Draw-Downs

    via Doug Short, Advisor Perspectives.


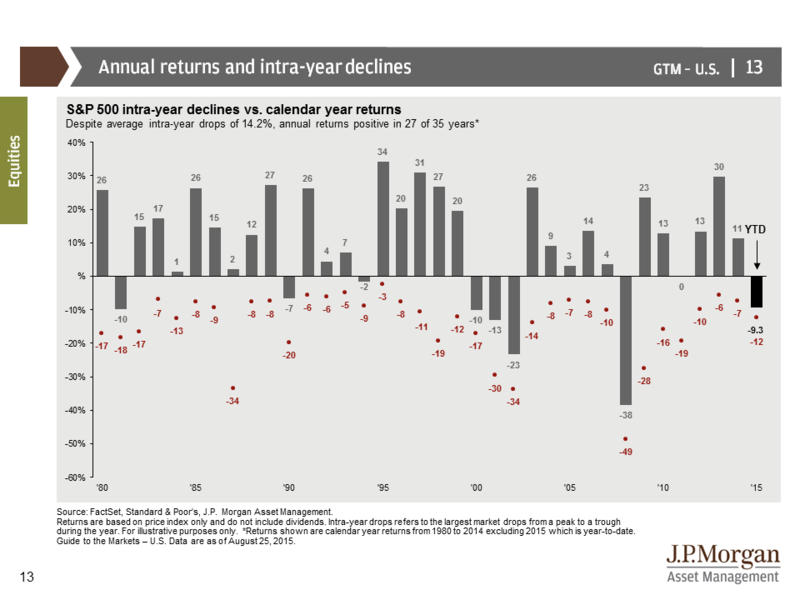
    Buy and Hold investors must stomach significant drawdowns to get their returns — even in 'good' years.

    The chart below shows S&P 500 intra-year declines compared with calendar year returns. The bars represent year-end returns since 1980, while the reddish dots mark each year's market low.


    150828 SP500 Annual Returns vs Intra-Year Declines

    via JPMorgan Guide to the Markets.


    According to Business Insider, here are the historical frequencies of certain market correction levels.

    Since 1900, we've seen:

    • 5% market corrections: 3x per year.
    • 10% market corrections: Once per year.
    • 20% market corrections: Once every 3.5 years.

    The point is that 10-15% pull-backs are normal (and perhaps even healthy) for the market.

    Interesting.

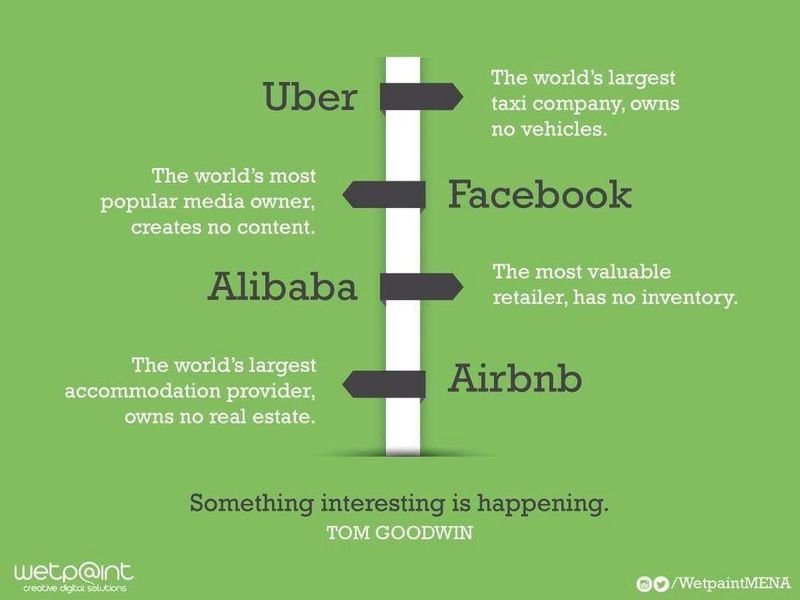
  • The New New – Something Interesting Is Happening

    The game is changing.  That means what you have to do to win is changing too.

    Take a look at this.  


    IMG_1211


    One of the most important phrases I’ve learned to use in business is “… or something better."

    Too many times, we have a specific idea of what we want – and how we want it.  Unfortunately, that focus can cause us to miss other (often better) opportunities.

    The same is true for people in the roles they play and the things they do. Too often, we fall into a rut and focus on the activities and efforts that we've planned (or have always done), instead of what's possible or preferable.

    One of the values that I stress here at Capitalogix is that the best way to grow the business is to grow the people. That sounds strange because so much of our business is based on technology. But the point is to continue to automate, delegate, or outsource things that we used to do … so that we can do something better.

    Something to think about!