May 2026

  • A Look at the Global Economy in 2026

    We live in interesting times!

    So whether you are a glass-half-full or a glass-half-empty person, you have plenty of ammunition.

    The news cycle is designed to monetize fear, so it reliably amplifies what is fragile, broken, or uncertain. But if you shift focus from the headlines to the data, the global economy in 2026 looks far more resilient (and more opportunity-rich) than most people realize.

    In this week’s commentary, I’ll walk through a few key charts that cut through the noise and highlight where growth, risk, and leverage are actually shifting.

    For example, you can focus on the $100 trillion global debt … but you could also focus on how U.S. states’ GDPs compare to global GDPs.

    The $126 Trillion Scoreboard

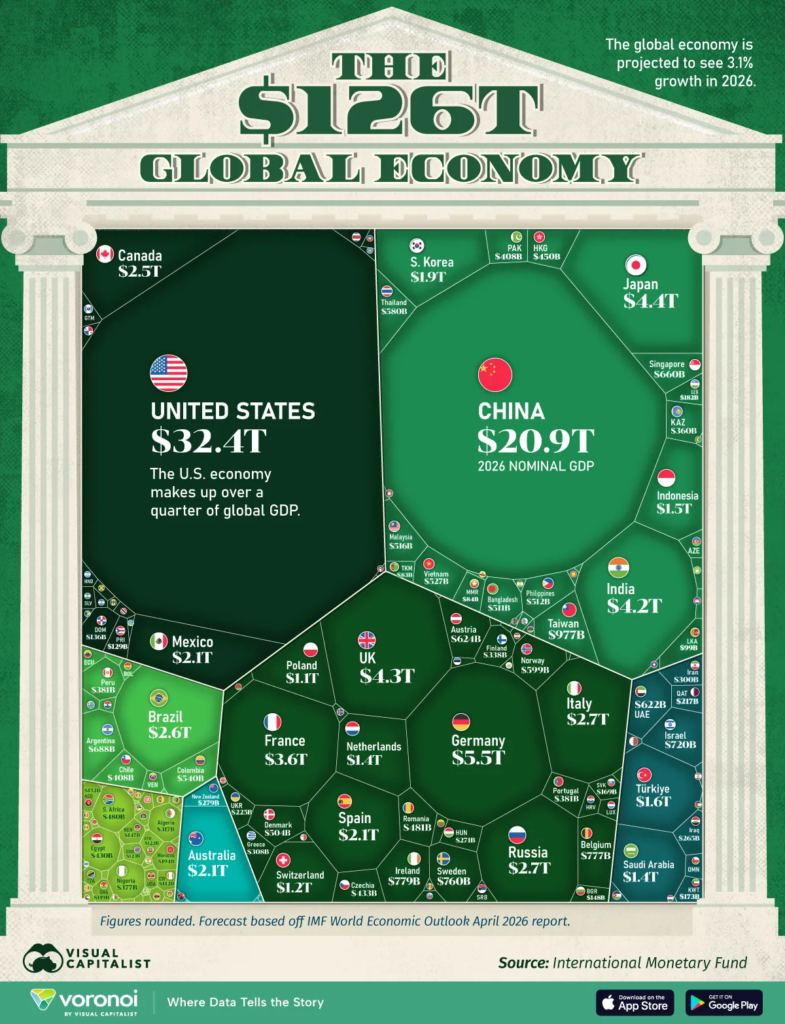
    The world economy is slated to reach $126 trillion this year, with four countries accounting for over half of that. Who tops the list?

    The United States. As we have for over 100 years.

    The graphic below visualizes the global economy as a whole using IMF projections from the April 2026 World Economic Outlook, breaking down nearly 200 countries by their share of nominal GDP.

    Infographic showing just four countries generate roughly half of all economic activity worldwide.

    via visualcapitalist

    Just four countries generate roughly half of all economic activity worldwide (U.S. ~$32T, China ~$21T, Germany ~$5T, and Japan ~$4T ). That concentration of economic power is striking, but as we’ll see, size alone doesn’t tell you who’s winning the next decade.

    Size Doesn’t Equal Speed

    Among the four largest economies, China is expected to lead with a projected 4.4% real growth in 2026, while the U.S. is anticipated to grow a solid 2.3%. In contrast, Germany and Japan (which have experienced years of stagnation) are forecast to grow only around 0.7–0.8%.

    China’s strong performance continues a trend observed over the past several decades, despite facing challenges such as a demographic slowdown and an ongoing property sector crisis.

    Once you look past the largest economies, there are real opportunities in large, fast‑growing markets across Asia. For example, India, at roughly $4.2 trillion in GDP, and Indonesia, at $1.5 trillion, are on track to play a much bigger role in the global order.

    With a forecasted 6.6% growth rate in 2026, India could surpass the United Kingdom and potentially Japan by 2028 — driven by a demographic dividend, expanding services exports, and rapidly maturing digital infrastructure. For entrepreneurs and investors, that shift isn’t just trivia; it should inform where you place bets, partner, and build.

    Tariffs, Trade, and the Debt Behind It All

    Since early 2025, high-tariff policies implemented by the U.S. have caused downward revisions in growth forecasts for several economies, especially in North America.

    Canada and Mexico are especially exposed. With U.S.-Canada relations strained and negotiations over a trilateral trade agreement progressing slowly, the North American economic bloc faces increasing uncertainty.

    via visualcapitalist

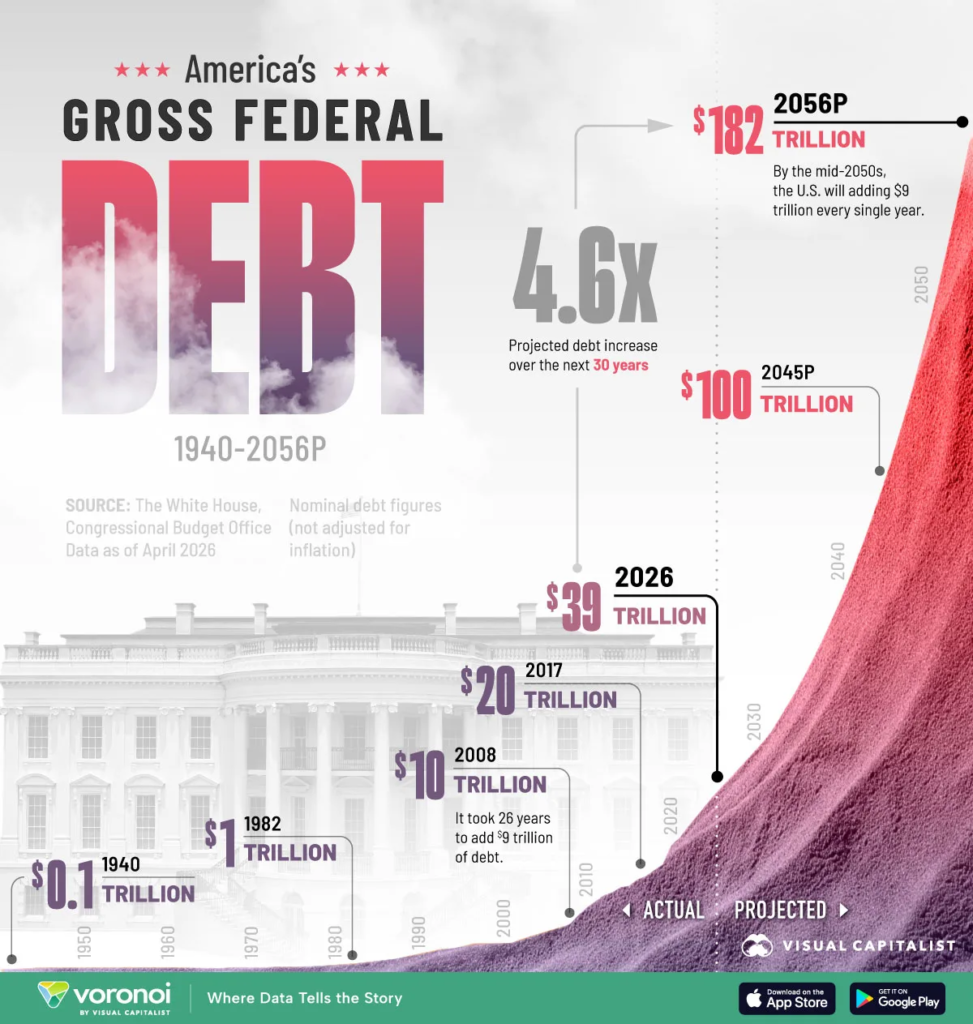
    After World War II, it took over 60 years for U.S. debt to reach $10 trillion. The next $10 trillion took 9 years to reach following the 2008 financial crisis. In the 2020s, pandemic spending compressed the interval to just five years.

    By the 2050s, each additional $10 trillion could take just one to two years.

    That is under modest assumptions, with no new wars, no recessions, and manageable interest rates. Even so, debt projections still reach $182 trillion by 2056. For context, we’re at about $39 Trillion now.

    That data comes from the Congressional Budget Office (CBO) and the White House as of March 2026.

    So is the Glass Half Full or Half Empty?

    The real story of the global economy isn’t just told with GDP rankings. While America and China dominate those numbers, it’s clear the landscape is changing.

    Traditional economic metrics might become less relevant in a world where regional conflicts, supply chain dynamics, and technological innovation can reshape global power dynamics overnight.

    In the longer term, birth rates and the growth of middle-class infrastructure are strong predictors of what lies ahead. That’s part of why we see so much growth in India and Indonesia.

    GDP alone doesn’t measure what truly matters in the modern global economy.

    The Variable That Changes Everything

    Looking beyond traditional economic metrics, I believe artificial intelligence will emerge as one of the most critical factors driving power, progress, and wealth creation in the coming years. It’s likely to become both the most coveted resource and the capability we’ll most actively seek to deny our adversaries.

    Economies that combine large markets, strong digital infrastructure, and responsive regulatory environments will be positioned to capture outsized gains. Those that lag on talent, compute, or data governance may see their nominal GDP grow while their strategic leverage erodes.

    Obviously, AI is something I think about and write about in many other articles, so even though I won’t add a detailed section here, it’s worth noting that AI is going to change the relative weight and importance of many other things in increasingly exponential ways.

    In conclusion, the scoreboard is changing on three fronts at once: where growth lives, how policy shapes risk, and how AI alters productivity and power. If you’re allocating capital or building companies in this environment, the advantage goes to leaders who can see beyond the fear‑driven headlines to where the real leverage is emerging.

    Onwards!

  • The Middle Seat Squeeze: The End of Spirit Airlines

    This week, Spirit Airlines announced it was shutting down. They’ve been the butt of jokes for a long time, and many people saw it coming. Nonetheless, their troubles say a lot about the economy, the air travel industry, and Spirit Airlines itself.

    The Times Are Changing

    I’ve spent enough time in the air to see the system from the inside … and things are definitely changing. 

    I grew up in a time when business deals were done face-to-face (and that didn’t mean Zoom). I’ve flown over 6 million miles butt-in-seat miles on American Airlines. To put that in perspective, it amounts to hundreds of flights a year at the peak. The kind of travel volume where small details (like upgrades, flight changes, and customer service) stop being luxuries and start being the difference between a manageable routine and a cascade of disasters.

    That experience has changed.

    I bet you’ve noticed it as well. Upgrades are harder to come by. Lounges are more crowded, and what used to be customer service has become a revenue center. The little efficiencies that made constant travel tolerable have been quietly stripped away.

    That’s not just nostalgia. It’s a signal.

    And the clearest version of that signal showed up somewhere else entirely.

    What Happened to Spirit?

    On Friday, Spirit announced it was closing after 34 years of operation, leaving thousands of travelers and employees in the lurch.

    On the surface, the reasons are straightforward: rising fuel costs, heavy debt, and an unsustainable balance sheet. But those explanations don’t fully answer the more important question … why does a company built around being the lowest-cost option no longer work?

    For a long time, the airline industry operated on a relatively stable exchange.

    At the bottom, you could sacrifice comfort for price. At the top, loyalty earned you a meaningfully better experience. And in the middle, there was enough balance that both ends could coexist. The average consumer would complain about travel, but not enough to stop them from booking that ticket.

    That exchange is breaking down.

    Spirit lived at one extreme. It stripped flying down to its bare minimum and charged for everything else. In doing so, it forced the rest of the industry to respond — introducing basic economy tiers and expanding access to cheaper travel.

    But that model only works if there’s room to be the absolute lowest-cost option. As costs rise and pricing becomes more sophisticated, that edge disappears. “Cheap” doesn’t go away, but it gets redefined.

    When there’s no longer enough margin to operate at that extreme, the model collapses.

    Something structurally similar is happening at the other end of the spectrum as well.

    Remember When Status Mattered

    Elite status used to be scarce. It meant something because relatively few people had it. And, to get it, you had to be a real road warrior.

    “I’ve flown over 6 million miles … and that used to mean something to the airline.”

    I remember a time when I would see familiar faces on my routine flights. I also remember a time when the airline telephone agent actually knew who I was (and vice versa).

    But over time, especially during and after COVID, airlines expanded access. And many of those road warriors have likely switched many of their flights to Zoom calls.

    Is the Travel Business Still About Travel?

    Credit cards became an alternative (and preferred) pathway to status. Short-term revenue became more important than long-term loyalty.

    The reality is that more passengers are competing for fewer upgrades. The same lounge space. The same finite set of perks. The experience gets diluted and devalued.

    That’s not an accident. It’s a reflection of where airlines are now making their money.

    Breaking Down the Breakdown

    Post-pandemic, carriers leaned heavily into premium travel. Higher fares, more segmented cabins, and more ways to extract value from passengers willing to pay for comfort or flexibility. At the same time, rising costs across labor, fuel, and financing have forced a more disciplined approach to pricing.

    The system hasn’t gotten worse. It’s gotten more optimized. But optimization changes the experience.

    Instead of a clear trade-off between price and comfort, we now have a layered system of constraints and upsells. Economy is fragmented into finer tiers. Premium is more expensive and more protected. And the space between them—where loyalty once created meaningful differentiation — has narrowed.

    Which, while a bummer for the price-conscious seasoned traveler, theoretically creates a more distinct experience at the two ends of the spectrum.

    That’s why both extremes are under pressure at the same time.

    At the bottom, a pure low-cost carrier like Spirit has no room to absorb shocks. At the top, loyalty programs have expanded beyond the capacity of their own benefits. In both cases, the underlying exchange no longer holds the way it used to.

    And when that happens, the outcomes start to look familiar.

    The middle compresses. The edges strain. The players that survive are either large enough to absorb volatility or differentiated enough to command higher prices.

    Airlines aren’t unique in this. You see the same pattern in retail, media, and parts of tech. More efficiency. More segmentation. More options on paper.

    But a narrower lived experience.

    So yes, flights feel more crowded. Perks feel less reliable. Even with millions of miles behind me, I recently found myself in a middle seat.

    But that’s not really the story.

    The system is still working. It’s just working differently.

    The underlying exchange has shifted. Loyalty no longer buys what it used to. Price no longer guarantees access the way it once did.

    More rational. More optimized.

    Just not as rewarding for the people who built their routines around the old version.

  • Rising Gas Prices: Where Are They The Highest?

    Last week, while I was in Portland, I noticed that gas prices were over $5, compared to my normal $3 in Texas. And in Texas, even $3 feels high.

    Gas prices rank among the most emotionally resonant economic indicators — visible on every corner, cited in earnings calls, and embedded in consumer sentiment surveys for decades.

    It made me wonder: where are gas prices the highest … and why? But that doesn’t tell the whole story. Instead, it might be better to look at the average annual gas spend per driver. Below is a chart showing that analysis for each state.

    Infographic looking at the average annual gas spent per driver

    via Visual Capitalist

    U.S. drivers spend between $1.6K and $3.3K per year on gas, depending on the state. The spread is significant. What’s counterintuitive is that gas prices aren’t the primary driving factor.

    A more useful lens looks beyond the price at the pump and measures the total annual fuel spend against actual miles driven, because often, behavior matters more than cost.

    High prices grab attention, but distance quietly does the damage.

    As a result, rural states like Wyoming rank highest in annual fuel spend, while Northeast states rank near the bottom — not because gas is cheap there, but because residents drive significantly less.

    When prices spike, the narrative focuses on the pump. Consumers feel it immediately. For some, it reshapes household budgets, travel plans, and business decisions.

    But this kind of breakdown shows that travel patterns often matter more than price alone.

    California is the clearest illustration. The state has the highest per-gallon prices in the country, yet ranks sixth in annual fuel spend at $2,705. Shorter average driving distances (11,780 miles per year versus a national average of 13,916) meaningfully offset the price premium.

    The same pattern shows up in reverse in the Northeast.

    In New York, drivers spend just $1,582 annually on fuel (about $700 less than the national average) largely because they drive fewer miles (9,185 per year). States like Rhode Island, Delaware, and New Jersey follow a similar pattern, where shorter commutes offset higher gas prices.

    Driving The Point Home

    Gas prices tell only part of the story. What really drives cost is how much we drive (and, to some extent, that’s demand-elastic). So, while high prices grab attention, decisions to minimize costs by doing less (or doing differently) have wide-ranging impacts.

    The other article this week considered what happened to Spirit Airlines. Obviously, fuel costs mattered; too bad they couldn’t have just operated shorter flights … Expect to see more examples of tough choices because of demand-elasticity and rising costs.