This is the time of year when many investors look back at 2025 and ask, ‘How did the markets do?’ It is not just about what made or lost money, but how each asset performed relative to the others.
Studying past performance is interesting, but it is not always helpful for deciding what to do next. This post looks at how 2025’s returns set the stage for 2026.
Because 2026 is a midterm election year, market performance is likely to matter even more to the party in power. With that said, the market is not the economy. Asset class performance reflects diverse economic forces (risk appetites, rate expectations, foreign growth, government interventions, and real asset demand), all interacting in a complex global backdrop.
Before thinking about what comes next, it helps to look back at how we got here.
A Look at Recent History
2022 was the worst year for the U.S. stock market since the 2008 financial crisis.
2023 was much better, but most of the gains came from a handful of highly concentrated sectors.
2024 saw nearly every sector post gains – driven primarily by AI enthusiasm and a robust U.S. economy. Bitcoin surged to an all-time high, and Gold saw its best performance in 14 years. On the other hand, bonds suffered amid reflationary concerns and fears of a growing deficit.
For 2025, I predicted a bullish year (driven by AI), but expected more volatility and noise. That is what we got and what we wrote about in the post: The Seven Giants Carrying the Market: What the S&P 493 Tells Us About The Future.
So, looking back, how did markets actually perform in 2025? Here is a table showing global returns by asset class.
A Global Look at 2025: Slowing, But Strong
At a high level, 2025 was a year of solid gains, with diversification paying off: metals and international markets led, while crypto lagged.
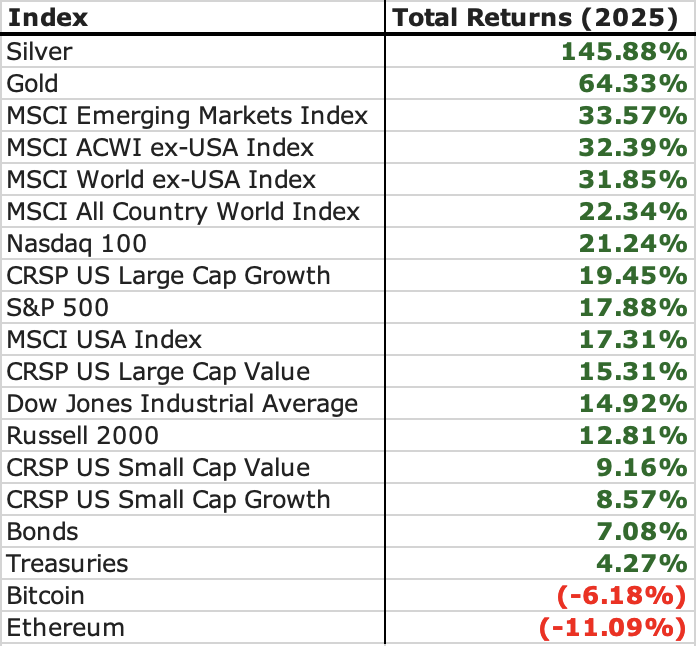
Here is a closer look at asset class performance (based on total return figures through the end of 2025):
- Silver (+145.88%) and Gold (+64.33%) dominated returns, a rare year where precious metals outperformed traditional equities.
- International equities surged, with the MSCI Emerging Markets Index (+33.57%) and MSCI World ex-USA Index (+31.85%) outpacing U.S. benchmarks.
- U.S. major indices such as the Nasdaq 100 (+21.24%) and S&P 500 (+17.88%) remained strong.
- Smaller U.S. stocks and value segments delivered respectable but more modest gains.
- Fixed income and bonds produced positive but lower returns.
- Cryptocurrencies — Bitcoin and Ethereum — ended the year with negative performance, illustrating ongoing volatility in digital assets.
This split suggests that 2025 became a year of diversification returns, with non-U.S. equities and metals playing a larger role than in recent U.S. market-centric rallies.
Diving Deeper Into Business Performance
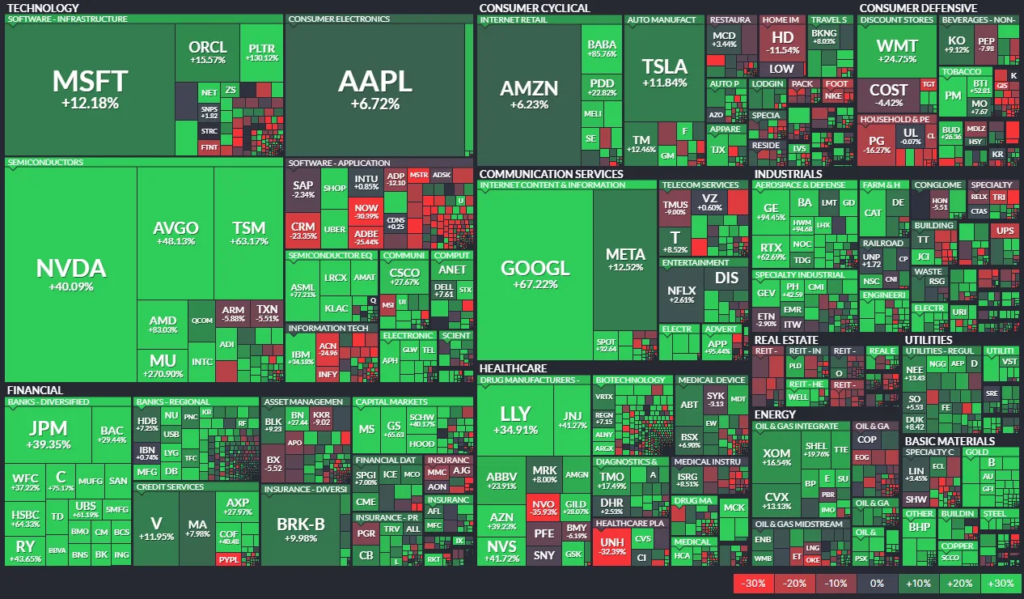
via visualcapitalist
One of the most striking themes in U.S. equities throughout 2025 was the pronounced divergence in performance across sectors and stocks, as illustrated by VisualCapitalist’s winners-and-losers visualization.
Unsurprisingly, AI and data infrastructure companies were among the biggest winners of the year.
Continuing the trend from our broader perspective, precious metal producers also saw gains, reflecting a wider appetite for inflation hedges and geopolitical safe havens.
Meanwhile, real estate investment trusts (REITs) struggled amid elevated borrowing costs and high yields, which made alternative income assets more attractive. Non-AI software companies and oil & gas stocks also underperformed.
In Closing
None of this guarantees how 2026 will play out. It does suggest a few things to watch: whether the strength in metals persists, whether international markets can build on their leadership, and whether crypto’s drawdown turns into a reset or a renewed rally. It also reinforces a familiar lesson: diversified, rules‑based portfolios can thrive even when leadership rotates (did you read last week’s article?)
On one level, a systematic, algorithmic approach means not spending too much time trying to predict markets. On another, it is hard not to think about what might come next — especially as AI becomes more influential and pervasive.
What do you expect for 2026? Will cryptocurrencies recover, or will they continue to shake out? Will AI keep booming at this pace or begin to normalize? And which sectors do you believe have the potential for the biggest surprises?
Onwards!