In 2021, we looked at the (then) $94 Trillion Global GDP.
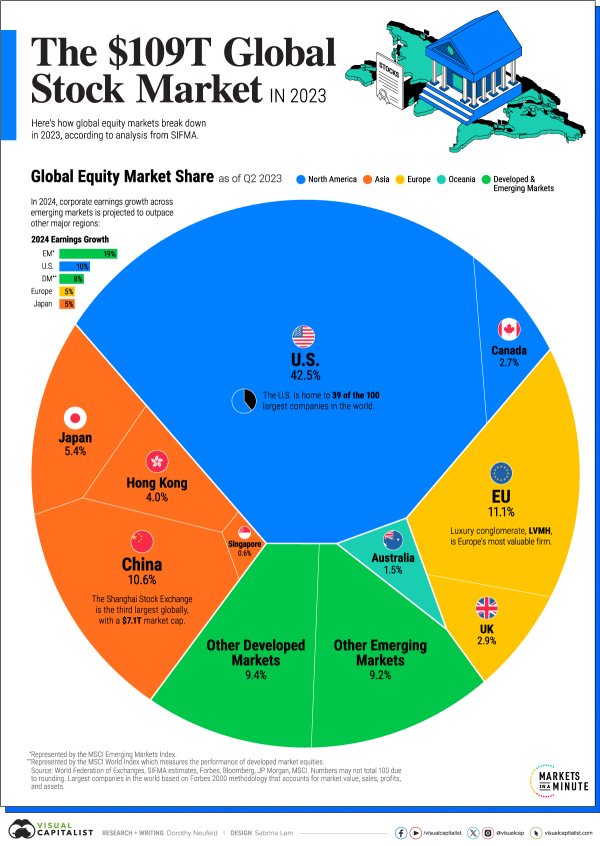
Today, I found a chart focusing on the $109 Trillion Global Stock Market.
While there are certainly still fears about recessions, downturns, and more, nonetheless, it's good to see some growth. To understand more about the market-cap-to-GDP ratio, check out this link.

Unsurprisingly, the U.S. and China dominate the list, accounting for over 50% of the global market themselves. Even less surprisingly, emerging markets saw the most growth last year.
Visual Capitalist points out that U.S. stocks have often outperformed other wealthy nations over the past several decades.
If an investor put $100 in the S&P 500 in 1990, this investment would have grown to about $2,000 in 2023, or four-fold the returns earned in other developed countries.
The U.S. has been the leader in this space for as long as I can remember, but as emerging countries start to gain their footing, it's likely our percentage of the pie will decrease. Hopefully, the pie gets bigger as that happens.
What do you think will happen?

Leave a Reply