Thought this was clever. It shows how different capabilities combine to form specialties.

via Drew Conway.
The second diagram adds one element (and some descriptive 'color') to the combinations.

via Joel Grus.
I think this helps explain a lot.

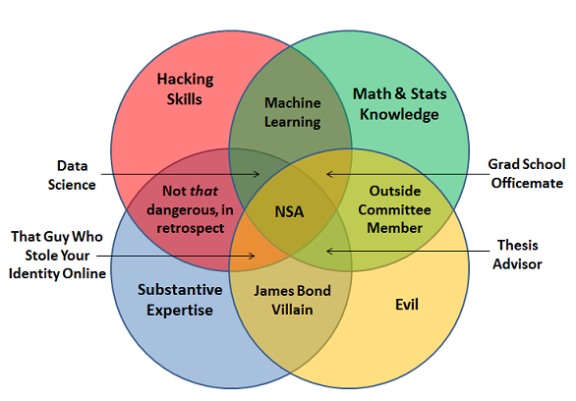
Thought this was clever. It shows how different capabilities combine to form specialties.
via Drew Conway.
The second diagram adds one element (and some descriptive 'color') to the combinations.
via Joel Grus.
I think this helps explain a lot.
Leave a Reply