Statistics can be misleading. For example, if markets are near the highs, they must be strong; right?
Gavekal Research recently put out a note that caught my eye.
Since 5/21/2015 (the date that the MSCI World Index made a high), 2 out of 3 mid-large cap stocks have declined.
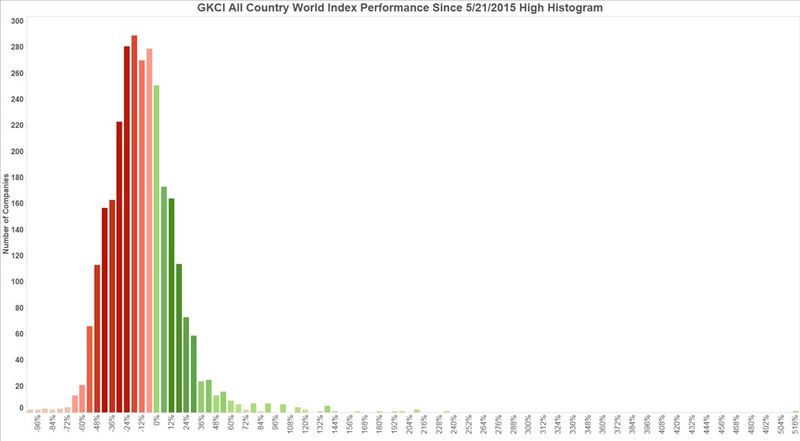
The histogram below shows the number of companies in Gavekal's version of the MSCI All-Country World Index that have had positive performance (green) or negative performance (red) since 5/21/2015.
Overall, 66% of stocks have declined over the past year -- while just 34% have posted unchanged or positive performance.
Interesting, but does that show opportunity or hidden weakness?
Comments
2/3 Of Global Stocks Are Down Since Last Year
Statistics can be misleading. For example, if markets are near the highs, they must be strong; right?
Gavekal Research recently put out a note that caught my eye.
Since 5/21/2015 (the date that the MSCI World Index made a high), 2 out of 3 mid-large cap stocks have declined.
The histogram below shows the number of companies in Gavekal's version of the MSCI All-Country World Index that have had positive performance (green) or negative performance (red) since 5/21/2015.
via Gavekal.
Overall, 66% of stocks have declined over the past year -- while just 34% have posted unchanged or positive performance.
Interesting, but does that show opportunity or hidden weakness?
Posted at 03:52 PM in Business, Current Affairs, Market Commentary, Trading, Trading Tools | Permalink
Reblog (0)