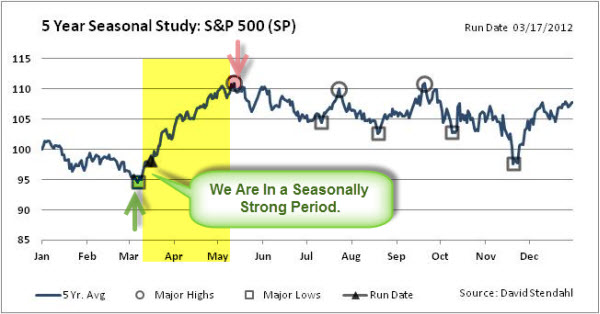
The S&P 500 Index is entering a seasonally bullish period. The chart below shows the predicted turning points based on the past five years of historical data.
Something potentially different this year is that the S&P 500 Index has performed pretty well year-to-date. In fact, it is up 12.17% so far … and things look pretty strong until May.
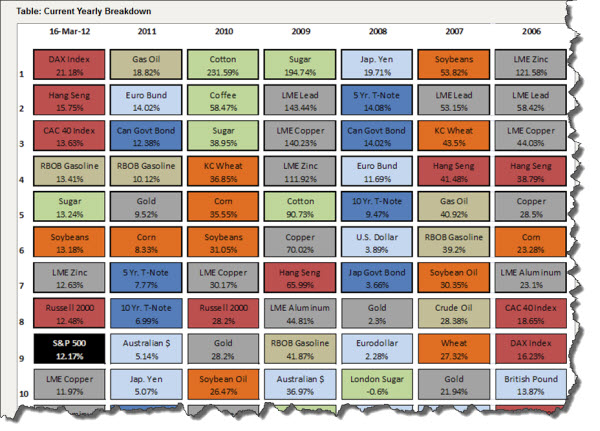
However,the chart below should serve as a reminder that there a lot other markets worth trading too. For starters, the DAX is up 21.18% so far this year.
The chart shows the top-ten performing markets for the past few years. Click the chart to see an expanded version of this data.
Note how much diversification there has been in the top-ten throughout the years.
That is the funny thing about markets … something is always working. The trick is finding it while it's working.


Leave a Reply