Here's a breakdown of forty global futures based on year-to-date performance.
It might be interesting to compare how your favorite market stands up to this list of various markets?
Other Performance Breakdowns:
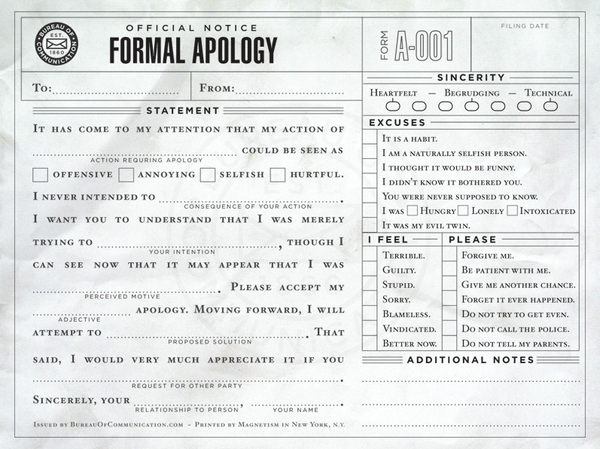
As a public service, I am sharing this Formal Apology from the Bureau of Communication.

Failure to use it has consequences.
For example, have you seen this video of what an angry father can do to his daughter's laptop?
Do you applaud the standard he is trying to teach her … or are you tempted to call Child Protective Services?
If she had just used the apology form …
As a public service, I am sharing this Formal Apology from the Bureau of Communication.

Failure to use it has consequences.
For example, have you seen this video of what an angry father can do to his daughter's laptop?
Do you applaud the standard he is trying to teach her … or are you tempted to call Child Protective Services?
If she had just used the apology form …
There has been a disconnect. Individual investors don't seem to care that the market continues to rally.
Here is a chart showing continued investor out-flows, even as the Dow Jones Industrial Average hits multi-year highs.
History seems to be on the Bulls' side. Here is a Bespoke chart showing what has happened after the S&P 500 Index rallies 15% (or more) in a three-month period.
It has been a pretty bullish indicator.
Moreover, sentiment is not not so frothy since the rally has been so widely ignored by individual investors. As a result, traders don't expect much panic-selling on a move down.
In addition, the Markets have been resilient through some scary news cycles recently.
The question is: can it continue?
Well, if the Market can't shake-out some sellers, the next surprise could very well be another move higher.
You don't have to look hard to find prices going up.
Here are some of the posts that caught my eye. Hope you find something interesting.
You don't have to look hard to find prices going up.
Here are some of the posts that caught my eye. Hope you find something interesting.