Explaining The U.S. Federal Budget Deficit [GRAPHIC]
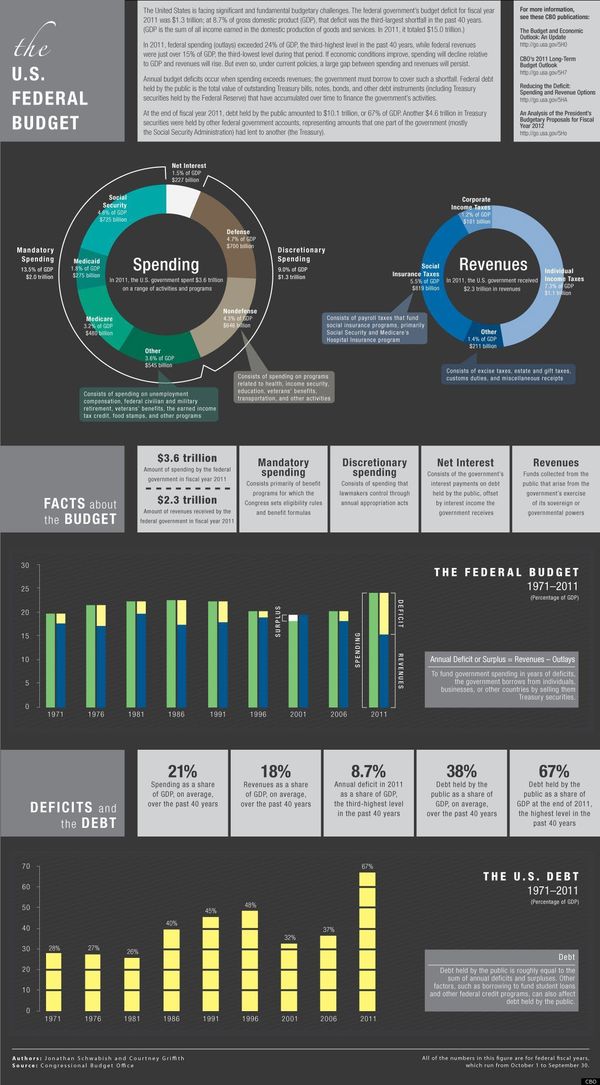
Here is a picture of our Federal Budget as we close out 2011.
Since last August, it's been clear that the United States federal deficit would top $1 trillion in 2011 for the third year in a row. At 8.7 percent of the nation's Gross Domestic Product, the debt-to-GDP ratio is one of the worst in the past 40 years, according to the Congressional Budget Office.
Government spending far outweighs, government revenues by a difference of nine percentage points in favor of spending, according to a CBO infographic .
The graphic also shows that individual's debt has grown especially large in recent years; debt held by the public accounted for 67 percent of U.S. GDP in 2011, the highest level in four decades.
Here is the U.S. federal budget infographic from the Congressional Budget Office.
via Huffington Post.
Posted at 05:10 PM in Business, Current Affairs, Ideas, Market Commentary, Trading | Permalink
Reblog (0)