 I got a new gadget. It is a Livescribe pen that records both what it hears and what you write.
From a small sample of using it about a dozen times so far, I am impressed; Livescribe works great, and delivers immediate benefit at meetings and seminars. I use it to review conversations and brain-storming sessions for clarification, or to catch something I missed the first time through.
It generates an interesting polarity of responses though. Some people get it instantly and want to know where they can buy them. Others couldn't care less. No one objected to its use during the meeting – and I suspect that it became invisible quickly.
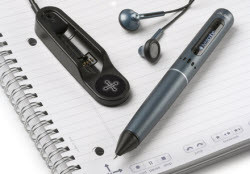
It records about a hundred hours of surprisingly clear audio. The pen has a camera, just above the tip, that captures the image of what is being written — and synchronizes this to what you hear or say. And if you go back and touch the tip of the pen to writing on the page, you hear what was being said while it was written. You can even control the playback speed to go faster, or slower, when you want.
The Livescribe pen looks and feels nice. It comes with a leather travel case and a dock to sync it with your computer. There is well-designed software that lets you manage and share the results. Livescribe created a place to post "pen-casts" online, to share with your team. You can limit who see it with an access control list or leave it open. Click here for an example.
I'm sending my son to back to school with one. It seems like the perfect environment for a tool like this.
All-in-all, Livescribe is worth a try. For more information about this interesting technology, here is the Livescribe's site.
Here are some video demos.
It looks like college book stores and Amazon are expected to be the big distribution channels.


