

![Reblog this post [with Zemanta]](http://img.zemanta.com/reblog_c.png?x-id=30e63534-77d4-4e62-b9aa-c2c2a037ea4a)
-
Iron Man 2 is Good Mindless Fun
 Have you seen it yet? It is certainly generating some "buzz" and box-office traffic.
My recommendation: let go of your expectations and simply enjoy the
spectacle.Even Freud has to agree, sometimes a cigar is just a cigar … and sometimes, a movie is just a movie.
Iron Man 2 was a fun and action-packed movie that I'm glad I watched on a big screen.
Does It Live-Up to Its Hype?
Before its release, there were a number of very negative reviews and predictions that it would be "unwatchable". Nonetheless, audiences are watching and, according to Rotten Tomatoes, enjoying the movie.
I had fun seeing it with my son this weekend. It was good enough in virtually every way.
The story held together well enough that I didn't think much about the plot (not that there was much of a plot to think about).
The graphics didn't "wow" me, the way that Avatar's did; but they were good enough that I didn't think about them (even though many of the special effects had to have been computer-generated).
Here is a Trailer so you can see it for yourself.
Here are more videos.
-
The President, as Comedian-In-Chief

President Obama was a hit at the annual White House Correspondents’ Dinner last week.
Jay Leno was the
headliner at the dinner, and Obama called him "the only person whose
ratings fell more than mine."Leno observed that Obama was less aloof
than he appears … "He loves to socialize … health care, car
companies," naming industries where the Obama administration has
intervened.The President got more laughs than Leno. Perhaps part of that was in
deference to positional power; however, give Obama some credit – he hired staff writers
from The Daily Show to come up with his material.![Reblog this post [with Zemanta]](http://img.zemanta.com/reblog_c.png?x-id=05248ddc-bd89-49cd-954a-42f96af9e1b5)
-
The President, as Comedian-In-Chief
President Obama was a hit at the annual White House Correspondents’ Dinner last week.
Jay Leno was the
headliner at the dinner, and Obama called him "the only person whose
ratings fell more than mine."Leno observed that Obama was less aloof
than he appears … "He loves to socialize … health care, car
companies," naming industries where the Obama administration has
intervened.The President got more laughs than Leno. Perhaps part of that was in
deference to positional power; however, give Obama some credit – he hired staff writers
from The Daily Show to come up with his material. -
This Sign of the Times May Say a Lot about the State of the Markets
A friend was driving me to his office last week. A flashy car pulls up beside us at a stoplight, and motions for us to roll-down the window. Without even saying hello, this well-dressed man in his late-40s starts bragging about day-trades he made recently.
 He asked my friend whether he bought the bank stock they talked about, and then went on to gloat about a few of his other successes, including buying Palm just before HP bought it.
When the light turned, he said "you should have listened" and drove away.
Little things can say a lot. What do you think this implies about the
state of the markets?I hadn't seen "that" type of behavior in several years.
It reminded me of cocktail parties in the late 90s (up until about 2001). You know, where stock-picking gurus wearing black faux-turtlenecks and blazers drank expensive wine and talked about Internet stocks.
![Reblog this post [with Zemanta]](http://img.zemanta.com/reblog_c.png?x-id=76e1c64f-12c5-4465-a9f6-3beb5f9d9c65)
-
This Sign of the Times May Say a Lot about the State of the Markets
A friend was driving me to his office last week. A flashy car pulls up beside us at a stoplight, and motions for us to roll-down the window. Without even saying hello, this well-dressed man in his late-40s starts bragging about day-trades he made recently.
He asked my friend whether he bought the bank stock they talked about, and then went on to gloat about a few of his other successes, including buying Palm just before HP bought it.When the light turned, he said "you should have listened" and drove away.
Little things can say a lot. What do you think this implies about the
state of the markets?I hadn't seen "that" type of behavior in several years.
It reminded me of cocktail parties in the late 90s (up until about 2001). You know, where stock-picking gurus wearing black faux-turtlenecks and blazers drank expensive wine and talked about Internet stocks.
-
Capitalogix Commentary for the Week of 05/03/10
The rally finally ran into some resistance. Still, the Dow Jones Industrial Average remains above 11,000. However, the thing that caught my eye last week was that the Dow
broke below its recent trend-line. By itself, not a cause for major concern, just a key to notice. The question is whether it can get back above that level, or will this be the start of a more meaningful correction?
It is also worth noting that the MACD indicator is showing more downside momentum than it did at the same price level earlier in April.A Peek Over the Wall.
Is
China's Shanghai Index sending a warning about the world economy or just
their economy?Unless things change in a hurry, China's Shanghai
Composite could drop significantly. This chart shows the triangle
pattern that played-out over the past nine months.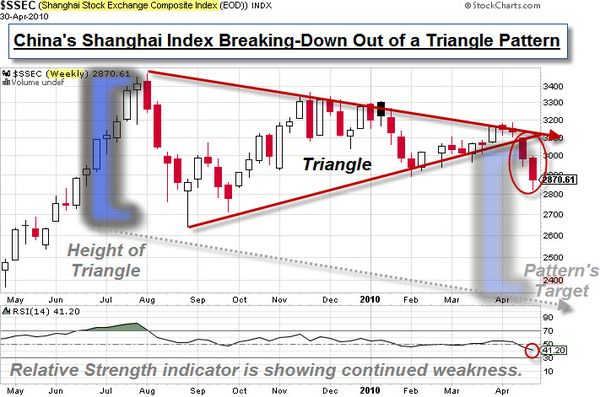
You can think of the Triangle as a well-contested battle
between the bulls and the bears. Inside the pattern, neither side
gives-up much ground. However, when one side loses conviction, the
market surges in the direction the winners push it.Triangles
are often continuation patterns. So, be wary that this move is a
head-fake down to trigger a big rally. Otherwise, the target is pretty
far below.Sentiment Here in the United States is Still Very Bullish.
While stocks have certainly become more volatile in the last two weeks, newsletter writers seem to be taking it in stride. According to Bespoke, the latest Investors Intelligence survey of newsletter writers found that 54% of those surveyed are now bullish on the market. The last time bullish sentiment was this high was back in December 2007, before the crash.

Another important to measure of the crowd’s extreme bullish sentiment is that fewer than 20% of advisors are currently bearish. According to Prieur du Plessis, these are first indications of a market top.
Another Sign of a Potential Top?
The U.S. Treasury Department plans to sell “up to” 1.5 billion
shares of Citigroup in the government’s
biggest step yet to exit the 27 percent ownership of the bank it rescued
during the financial crisis. Bloomberg quotes Geithner as saying: "We’re
putting TARP
out of its misery," and "the government is withdrawing from the
financial industry after forcing lenders to recapitalize with private
money."If you think that is funny, then so is this cartoon.

Business Posts Moving the
Markets that I Found Interesting This Week:
- Hussman: Rally Has Ignored Fundamentals & Will Be Corrected
Painfully. (BizInsider) - Earnings Growth: Are the Gains Too Good to Last? - (BusinessWeek)
- The Looming De-Leveraging Challenge. (McKinsey
Quarterly) - UBS to Retail Clients: Stock Boom Is Over. (InvestmentNews)
- Worried about the PIIGs: Was Greece's Rescue Futile & is
Portugal
Next? (WikInvest) - More Posts
Moving the Markets.
Lighter Ideas and
Fun Links
that I Found Interesting This Week- Microsoft Won 10 Times More Patents Than Apple In 2009.
(BusinessInsider) - Peek at Tomorrow: Ten Technology Incubators Changing The World.
(Forbes) - Computer Science Loses to Math in New Hiring Formulas. (WSJ)
- Bacterial Colonies Show Intelligence Coping with a Hostile
Environment. (Seed) - World Air Traffic Time-Lapse Video Over a 24-Hour Period.
(HuffingtonPost) - More
Posts with Lighter Ideas and Fun Links.
![Reblog this post [with Zemanta]](http://img.zemanta.com/reblog_c.png?x-id=2206e9c8-142d-4775-b2bf-449da0f3ae8c)
- Hussman: Rally Has Ignored Fundamentals & Will Be Corrected
-
Capitalogix Commentary for the Week of 05/03/10
The rally finally ran into some resistance. Still, the Dow Jones Industrial Average remains above 11,000. However, the thing that caught my eye last week was that the Dow
broke below its recent trend-line. By itself, not a cause for major concern, just a key to notice. The question is whether it can get back above that level, or will this be the start of a more meaningful correction?
It is also worth noting that the MACD indicator is showing more downside momentum than it did at the same price level earlier in April.A Peek Over the Wall.
Is
China's Shanghai Index sending a warning about the world economy or just
their economy?Unless things change in a hurry, China's Shanghai
Composite could drop significantly. This chart shows the triangle
pattern that played-out over the past nine months.
You can think of the Triangle as a well-contested battle
between the bulls and the bears. Inside the pattern, neither side
gives-up much ground. However, when one side loses conviction, the
market surges in the direction the winners push it.Triangles
are often continuation patterns. So, be wary that this move is a
head-fake down to trigger a big rally. Otherwise, the target is pretty
far below.Sentiment Here in the United States is Still Very Bullish.
While stocks have certainly become more volatile in the last two weeks, newsletter writers seem to be taking it in stride. According to Bespoke, the latest Investors Intelligence survey of newsletter writers found that 54% of those surveyed are now bullish on the market. The last time bullish sentiment was this high was back in December 2007, before the crash.
Another important to measure of the crowd’s extreme bullish sentiment is that fewer than 20% of advisors are currently bearish. According to Prieur du Plessis, these are first indications of a market top.
Another Sign of a Potential Top?
The U.S. Treasury Department plans to sell “up to” 1.5 billion
shares of Citigroup in the government’s
biggest step yet to exit the 27 percent ownership of the bank it rescued
during the financial crisis. Bloomberg quotes Geithner as saying: "We’re
putting TARP
out of its misery," and "the government is withdrawing from the
financial industry after forcing lenders to recapitalize with private
money."If you think that is funny, then so is this cartoon.
Business Posts Moving the
Markets that I Found Interesting This Week:
- Hussman: Rally Has Ignored Fundamentals & Will Be Corrected
Painfully. (BizInsider) - Earnings Growth: Are the Gains Too Good to Last? - (BusinessWeek)
- The Looming De-Leveraging Challenge. (McKinsey
Quarterly) - UBS to Retail Clients: Stock Boom Is Over. (InvestmentNews)
- Worried about the PIIGs: Was Greece's Rescue Futile & is
Portugal
Next? (WikInvest) - More Posts
Moving the Markets.
Lighter Ideas and
Fun Links
that I Found Interesting This Week- Microsoft Won 10 Times More Patents Than Apple In 2009.
(BusinessInsider) - Peek at Tomorrow: Ten Technology Incubators Changing The World.
(Forbes) - Computer Science Loses to Math in New Hiring Formulas. (WSJ)
- Bacterial Colonies Show Intelligence Coping with a Hostile
Environment. (Seed) - World Air Traffic Time-Lapse Video Over a 24-Hour Period.
(HuffingtonPost) - More
Posts with Lighter Ideas and Fun Links.
- Hussman: Rally Has Ignored Fundamentals & Will Be Corrected
-
The Truths Told By International Flags
"Meet the World" uses national flags to represent relevant social or political issues and real data specific to the particular country.
It comes from an award-winning ad series created for a Portuguese news magazine, Grande Reportagem, known for its photo-journalism and investigative reporting.
Here are a few examples.

Interesting and thought provoking.
-
KFC’s Double Down Sandwich – The New Health Food?
 KFC's new Double Down sandwich has been getting tons of press since its ingredients were revealed. Some blogs are calling the sandwich "disgusting", while others
gleefully talk about their eating experience.The Double Down is essentially a sandwich with two chicken fillets taking the place of bread slices. In between are two pieces of bacon, melted slices of Monterey Jack and Pepper Jack cheeses, and a "zesty" sauce (you know, things your cardiologist is secretly happy you're putting into
your system).How Bad For You is Eating Something Like This?
While it certainly doesn't qualify as health food … it also doesn't
have bread. Further, according to KFC, it weighs
in at a reasonable 540 calories, 32 grams of fat, and (a less
reasonable) 1,380 milligrams of sodium, Other sources argue that thecalorie count is much higher.
Regardless, there are lots of fast foods worse for you than this
sandwich (clickhere to see the rankings). Some even claim the Double Down is
healthier for you than a salad (seewhy).
It Might Not Be Great Food, But the Marketing Is Working.
The marketing has been pretty effective driving demand and generating buzz in the media. Here is one of their commercials.
After seeing it, my teenage son begged me to get him one. Okay, it didn't
take much
persuading.Nonetheless, I've been counting calories, recently, and
logging what I eat
in an attempt to eat healthier and lose weight. Like my wife, my skinny
pants (still patiently waiting in an under-used corner of the closet) hoped Iwould put up more of a fight than I did.
In advertising, attention is good (even if some of it is controversial). It looks like the folks at this Pepsi spin-off, Yum Brands, have a hit. Not only are people who wouldn't normally eat at a KFC, now eating at KFC … There's a bunch of folks fighting about whether this is a good or bad thing.
When Wendy's came out with the Clara Peller commercials, with the
tag-line: "Where's the beef?" … it changed their business. Kentucky Fried
Chicken needs a tag-line (or brand promise) that will capture more than the
disgust of the American public, if they want this to last.Now that KFC is getting buzz, the bigger questing is whether it will have a lasting impact on their sales?

Other Links.
- ZeitGeist: KFC's shocking new sandwich (YouTube)
- KFC's Double Down: A cheesy, sodium-filled sandwich — will you be
buying? (LATimes) - Here is KFC's Press Release about the sandwich. (KFC)
![Reblog this post [with Zemanta]](http://img.zemanta.com/reblog_e.png?x-id=cc764fba-3ca3-4840-a5d4-dd9968439010)


My recommendation: let go of your expectations and simply enjoy the
spectacle.
Even Freud has to agree, sometimes a cigar is just a cigar … and sometimes, a movie is just a movie.
Iron Man 2 was a fun and action-packed movie that I'm glad I watched on a big screen.
Does It Live-Up to Its Hype?
Before its release, there were a number of very negative reviews and predictions that it would be "unwatchable". Nonetheless, audiences are watching and, according to Rotten Tomatoes, enjoying the movie.
I had fun seeing it with my son this weekend. It was good enough in virtually every way.
The story held together well enough that I didn't think much about the plot (not that there was much of a plot to think about).
The graphics didn't "wow" me, the way that Avatar's did; but they were good enough that I didn't think about them (even though many of the special effects had to have been computer-generated).
Here is a Trailer so you can see it for yourself.
Here are more videos.