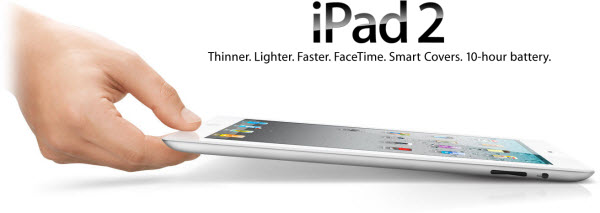
A small software company, started by a friend of mine, just did something that surprised me. It bought a new iPad for each of its employees.
Some companies will justify purchasing an iPad for key executives as a consumption tool. Other companies may justify purchasing an iPad for a developer, as a way to get them used to the form factor. Still other companies may purchase iPads as an incentive to recruit or retain employees and to foster a sense of a "cool" environment.
This Time It Is Different.
What strikes me is how fast this wave of tablet computing is taking-off. Yes, I remember how many times companies have tried non-traditional PC initiatives. In fact, my attic is an electronics graveyard for many of the earlier attempts. However, this time is different. I see 60-year-old men in McDonald's using and iPad to play Scrabble. I see 50-year-old business-people doing their work using iPads on an airplane. Moreover, I see data being formatted for easier consumption on those devices.
The result is that this probably represents a fundamental change.
Back in the 90s, the Internet finally took off. Early adopters talked about how long they were doing similar things with AOL, CompuServe or Delphi. Yet, when the Internet finally took off something changed.
Would you have guessed that a decade later electronics chain stores (like Circuit City) or bookstores (like Borders) would be casualties? Think how it affected the U.S. Post Office, telephone companies, etc. The list of winners and losers from that shift can be a lesson or an example.
A Different Look at the Same Issue.
I grew up with LP records. In high school, I watched eight-track tapes give way to cassettes. Then CDs gathered market share. After that, MP3s came along. Something funny happened along the way though … An MP3 file is just a song; but modern MP3 players allow you to carry your entire music library with you wherever you go. It's not just a linear progression; something happened and the whole value proposition transformed.
We are watching a similar technology shift happen right now. To borrow a line from Sun Microsystems, "the network is the computer".
More of our data, applications, and services are moving to the "Cloud". And a tool like the iPad can become much more significant than merely the device itself. It becomes the portal giving you access to everything on your company's private computers, as well as what's available on the public Internet. Again, the whole value proposition transforms.
A decade from now, there will be a whole new list of beneficiaries and casualties from this quantum shift.
Something to think about; who will be the big winners and losers?
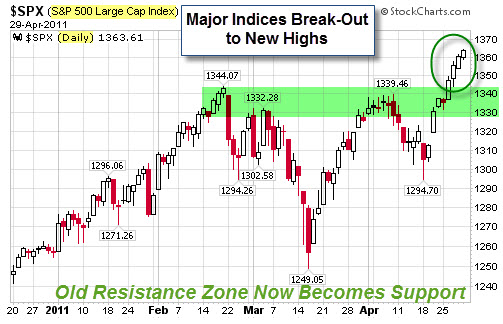
While the US Equity Indices have broken out above recent highs to continue their up-trend, I hear traders complain that this hasn't been an easy market to trade.
On one hand, you'd think that a straight-shot bull run higher would feel as safe as the kiddie rides at the amusement park. On the other hand, sagging internal breadth, divergences, and the impending end of QE2 have triggered cautious instincts in many professional traders. As a result, many are selling strength, and end up under-invested during the next push higher.
It's been even more challenging for the Bears, who keep trying to identify and sell a top in this market. However, there's been little selling follow-through. My guess is that because so few people are fully invested in the equity markets, each dip (no matter how small) seems like a buying opportunity to someone.
So, how long can the markets continue to produce these straight up moves to new highs? While the answer would seem to be "indefinitely", we know that's not realistic either. This seems a lot like the market did from December through February, where we barely saw a red day; but you couldn't help wondering each day if this was the top.
A Little Politics and Economic Policy.
On a side note, Fed Chairman Bernanke held a press conference last week. It was the first ever press conference immediately following a Federal Reserve meeting. Historically, the Fed has released minutes of their meetings about three weeks afterwards. Now, they expect to hold these sessions after every meeting.
On the surface, Bernanke's comments reiterated that the Fed was resolute in their intent to stop QE2 and doesn't desire to reverse the current trend of inflation or a weakening dollar. What caught my eye, however, was how Gold and Silver spiked as he spoke.
It is worth noting that the U.S. Dollar has fallen 31% so far this year compared to Gold. Likewise the Dollar has fallen 25% against the Swiss Franc (which many consider the gold standard of Fiat Currencies). For what it is worth, the Dollar Index is barely a percentage point above the all-time lows set before the financial panic in 2008.
While the US Equity Indices have broken out above recent highs to continue their up-trend, I hear traders complain that this hasn't been an easy market to trade.
On one hand, you'd think that a straight-shot bull run higher would feel as safe as the kiddie rides at the amusement park. On the other hand, sagging internal breadth, divergences, and the impending end of QE2 have triggered cautious instincts in many professional traders. As a result, many are selling strength, and end up under-invested during the next push higher.
It's been even more challenging for the Bears, who keep trying to identify and sell a top in this market. However, there's been little selling follow-through. My guess is that because so few people are fully invested in the equity markets, each dip (no matter how small) seems like a buying opportunity to someone.
So, how long can the markets continue to produce these straight up moves to new highs? While the answer would seem to be "indefinitely", we know that's not realistic either. This seems a lot like the market did from December through February, where we barely saw a red day; but you couldn't help wondering each day if this was the top.
A Little Politics and Economic Policy.
On a side note, Fed Chairman Bernanke held a press conference last week. It was the first ever press conference immediately following a Federal Reserve meeting. Historically, the Fed has released minutes of their meetings about three weeks afterwards. Now, they expect to hold these sessions after every meeting.
On the surface, Bernanke's comments reiterated that the Fed was resolute in their intent to stop QE2 and doesn't desire to reverse the current trend of inflation or a weakening dollar. What caught my eye, however, was how Gold and Silver spiked as he spoke.
It is worth noting that the U.S. Dollar has fallen 31% so far this year compared to Gold. Likewise the Dollar has fallen 25% against the Swiss Franc (which many consider the gold standard of Fiat Currencies). For what it is worth, the Dollar Index is barely a percentage point above the all-time lows set before the financial panic in 2008.
Heather Dorniden, from the University of Minnesota, races the 600m at the Big 10 Indoor Track Championships. What happens reminds what a race really is about … and, perhaps, what life is really about.
Heather Dorniden, from the University of Minnesota, races the 600m at the Big 10 Indoor Track Championships. What happens reminds what a race really is about … and, perhaps, what life is really about.
Gold continues to receive the headlines, yet silver is really moving.
Bespoke posted a chart that highlights how remarkable silver's run has been.
Had you invested $100 in silver ten years ago today, your investment would now be worth $1,037. A $100 investment in gold would be worth about half that at $569, and a $100 investment in the stock market (S&P 500) would be worth just $107.48.
Gold continues to receive the headlines, yet silver is really moving.
Bespoke posted a chart that highlights how remarkable silver's run has been.
Had you invested $100 in silver ten years ago today, your investment would now be worth $1,037. A $100 investment in gold would be worth about half that at $569, and a $100 investment in the stock market (S&P 500) would be worth just $107.48.