
What happens doesn't matter nearly as much as what you what make it mean … and what you choose to do.
Dallas got about an inch of ice and snow towards the end of last week, and we are still at a virtual stand-still five days later.
Growing up in New England, this would have been so minor that people wouldn't have called it a 'storm'. Because ice is so rare here, and we don’t have sanding, salting, or scraping capabilities (or people skilled enough to be comfortable driving in it) this was a Storm.
As a result, the best plans gave way to the shut-down.

Snow isn't 'good' or 'bad' … and neither was the change of plans.
Fund managers recognize the importance of sensibly diversifying risks and opportunities.
Be that as it may, as MotherJones reported in the wake of the financial crisis, the nation's 10 largest financial institutions held 54% of our total financial assets (compare that to the 20% they held in 1990). Meanwhile, the number of banks has dropped from more than 12,500 to about 8,000.
Here is a map, from the Federal Reserve, that shows the consolidation. Click to see a bigger version.
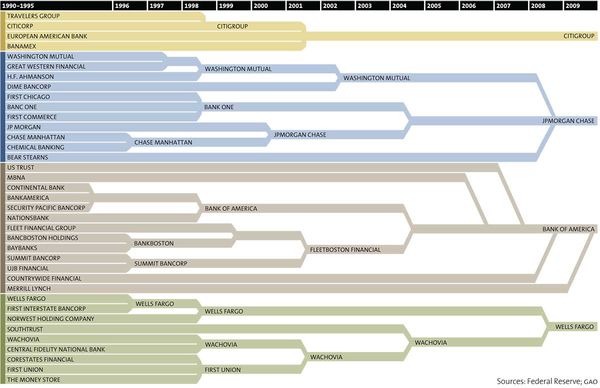
The infographic, above, shows how 37 banks have merged to become just four — JPMorgan Chase, Bank of America, Wells Fargo and CitiGroup (in a period of barely two decades).
Many people are shocked by a chart like this. It must be 'bad' to have so much controlled by so few, right?
But it isn't hard to find a version of this story playing-out in other industries: Print Media, Music, Broadcast Channels, Consumer Products … this type of consolidation happens for a reason.
A firm that marshals that more resources gains competitive advantage and has more ways to win.
They benefit from economies of scale, transactional leverage, better distribution and partners, and more ways to diversify risks. In addition, if they work to communicate, collaborate, and coordinate their actions (and data) they can unlock opportunities that others simply don't have (or can't see).
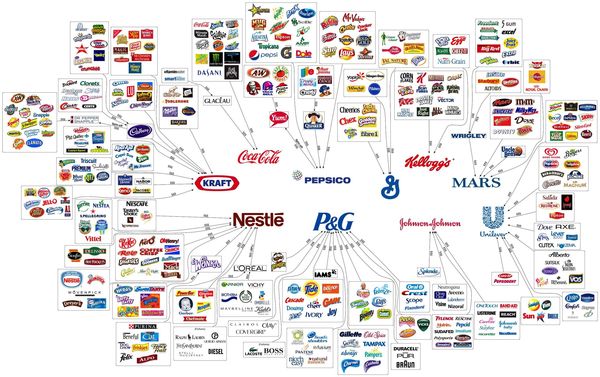
Here is a Chart Showing Some of the 'Winners' at that Game.
The following chart highlights our "Illusion of Choice". A surprisingly big portion of what you buy comes from one of these 10 mega-companies (Kraft, Coca-Cola, PepsiCo, Kellog's, Nestlé, Proctor & Gamble, , Mars, Johnson & Johnson, General Mills, and Unilever).
It's amazing to see what these giants own or influence. Click the picture to see a bigger version.
via Reddit.
Here is a more specific example. You probably think you are familiar with Nestlé. It is famous for chocolate; but did you realize it was $200 billion-corporation … and the biggest food company in the world? Nestlé owns nearly 8,000 different brands worldwide, and takes a stake in (or is partnered with) many others. Included in this network is shampoo company L'Oreal, baby food giant Gerber, clothing brand Diesel, and pet food makers Purina and Friskies.
Kind of cool?