Thought this was funny. Hope you enjoy it too.
Care to guess where my wife fits?
There is even merchandise … and a much shorter women's guide to men.


Thoughts about the markets, automated trading algorithms, artificial intelligence, and lots of other stuff
Thought this was funny. Hope you enjoy it too.
Care to guess where my wife fits?
There is even merchandise … and a much shorter women's guide to men.
Despite Canada's considerable geographic challenges, a friend sent me this as a reminder.
This chart shows the country to which each state exports the most. The states that border Mexico send a lot of goods there, while 35 states have Canada as their biggest export partner.
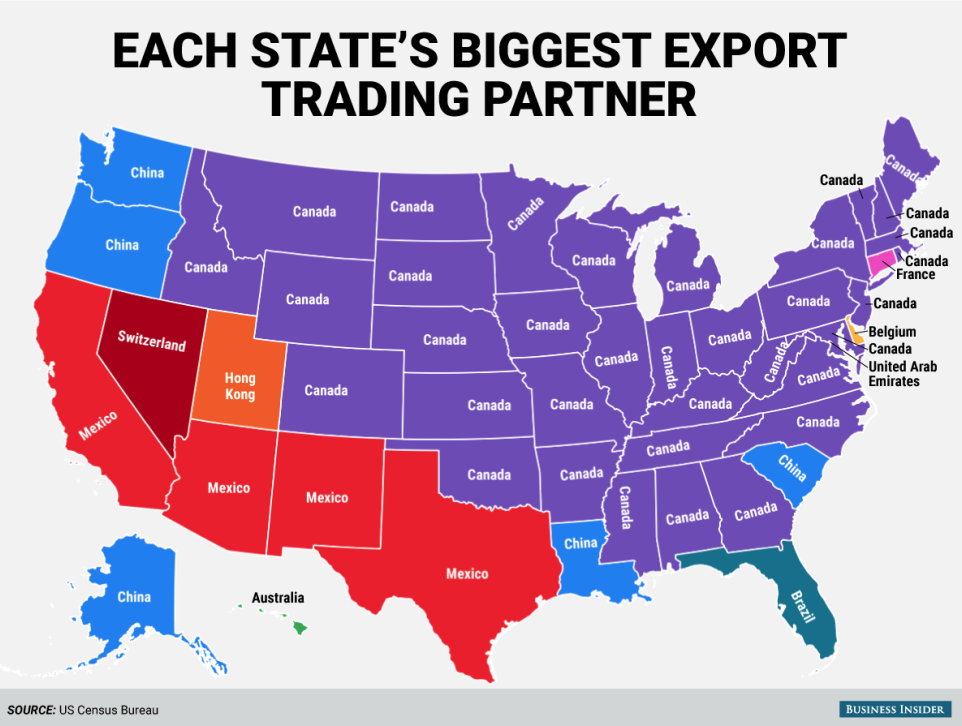
via Business Insider.
Back to the chart … International trade is a big part of America's economy, and a factor in each of the fifty state economies that constitute it.
The Census Bureau publishes annual figures on each state's international trade. In addition to the top 25 goods imported and exported by each state, the Bureau reports the 25 countries each state imports the most from and exports the most to.
In addition, here is a list of the U.S.'s largest trading partners (including a different list showing countries of which U.S. is the largest trading partner).
Finally, here is a link to a map showing U.S. states renamed for countries with similar GDPs.
Muhammad Ali, considered by many to be the greatest heavyweight boxer of all time, died last Friday at 74 years old.
Besides boxing, he was known for his quick wit, sharp tongue, and memorable quotes.
Here's one of my favorites.
“Impossible is just a big word thrown around by small men who find it easier to live in the world they've been given than to explore the power they have to change it. Impossible is not a fact. It's an opinion. Impossible is not a declaration. It's a dare. Impossible is potential. Impossible is temporary. Impossible is nothing.”
Here's another.
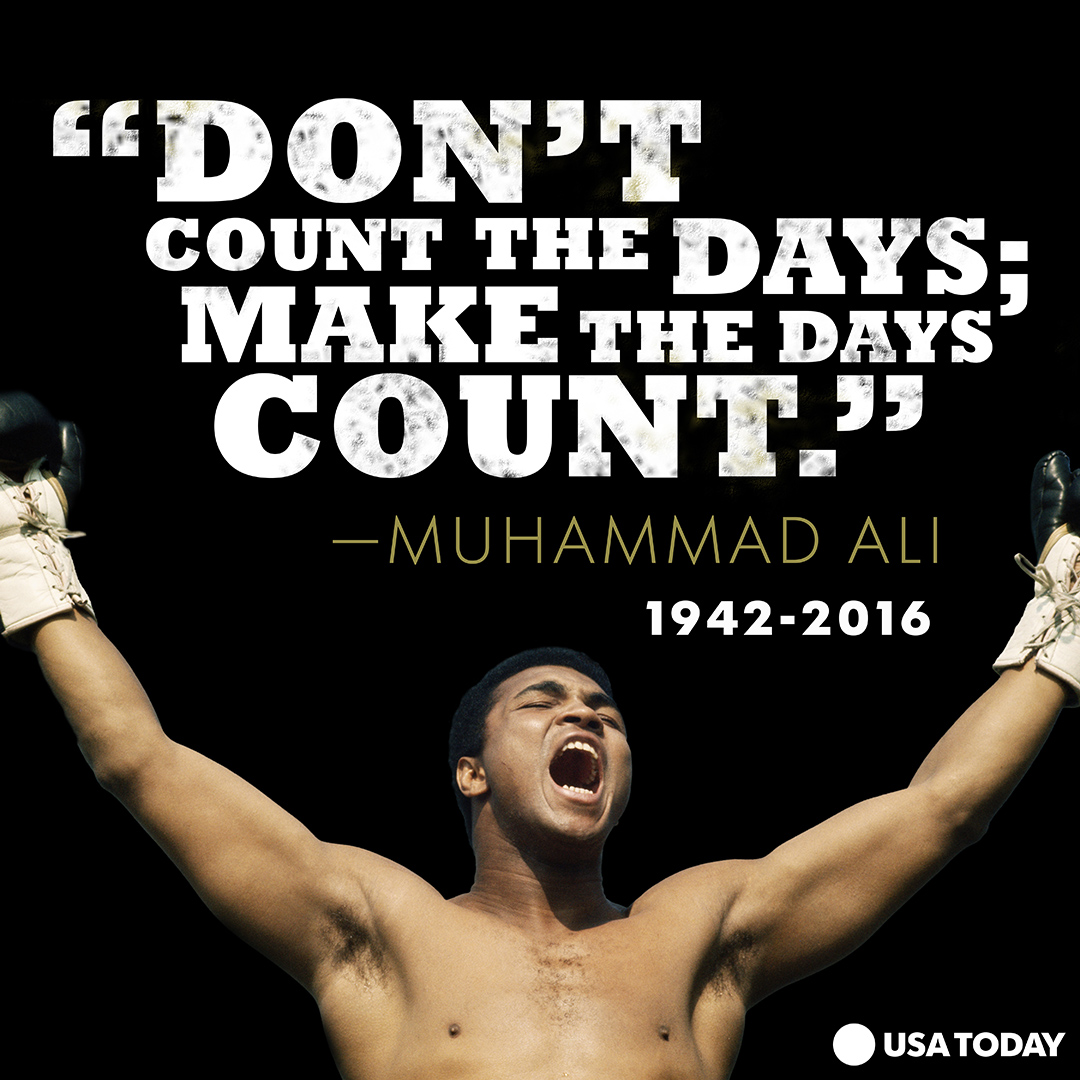
via USAToday.
Here is a link to some great photos.
There are many videos recounting his life and the times, but I like this video because it shows him doing what made people call him "The Greatest".
You know you are old if you remember life before emojis.

Here are some of the posts that caught my eye. Hope you find something interesting.
You know you are old if you remember life before emojis.
Here are some of the posts that caught my eye. Hope you find something interesting.
We’re now three trading days into the month of June, and the market is pretty much right where it ended May … Near the highs, but with faltering momentum.
Even though there haven't been big end-of-day gains or losses yet, the action has been noteworthy.
As you can see in the intraday chart of the S&P 500 below, there has been a big sell-off each morning, just after the open of trading. However, that has been followed by steady buying throughout the trading day – all the way into the close.
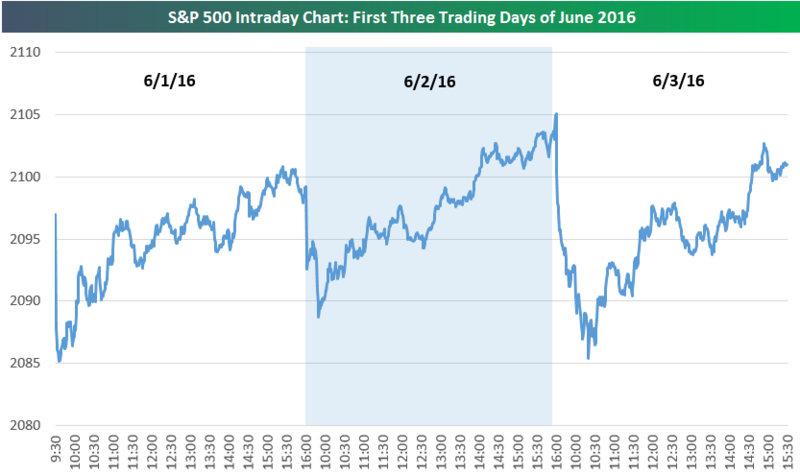
Early-morning selling followed by steady intraday buying, especially into the close, is seen as a bullish signal for the market.
Moreover, there was intraday buying, even on Friday, as the market digested a horrible jobs report at 8:30 AM ET. Nonetheless, buyers stepped in by 10:30.
In addition, below is a look at S&P 500 sector breadth levels (as measured by the percentage of stocks trading above their 50-day moving averages).
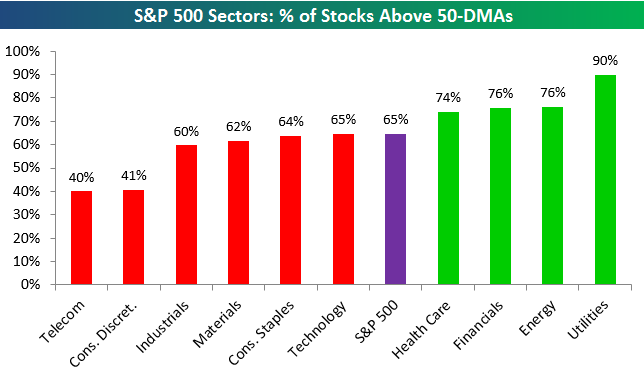
According to Bespoke, 65% of stocks in the S&P 500 are trading above their 50-days (which is a solid reading).
Sectors where breadth is strongest include Utilities, Energy, Financials and Health Care.
While the Financial sector still has a stronger reading than the S&P 500 as a whole, its breadth was much stronger prior to Friday's jobs number. The weak employment number pushed rate-hike estimates further out, and Financials had been performing well due to increased hawkishness from the Fed prior to today.
We’re now three trading days into the month of June, and the market is pretty much right where it ended May … Near the highs, but with faltering momentum.
Even though there haven't been big end-of-day gains or losses yet, the action has been noteworthy.
As you can see in the intraday chart of the S&P 500 below, there has been a big sell-off each morning, just after the open of trading. However, that has been followed by steady buying throughout the trading day – all the way into the close.
Early-morning selling followed by steady intraday buying, especially into the close, is seen as a bullish signal for the market.
Moreover, there was intraday buying, even on Friday, as the market digested a horrible jobs report at 8:30 AM ET. Nonetheless, buyers stepped in by 10:30.
In addition, below is a look at S&P 500 sector breadth levels (as measured by the percentage of stocks trading above their 50-day moving averages).
According to Bespoke, 65% of stocks in the S&P 500 are trading above their 50-days (which is a solid reading).
Sectors where breadth is strongest include Utilities, Energy, Financials and Health Care.
While the Financial sector still has a stronger reading than the S&P 500 as a whole, its breadth was much stronger prior to Friday's jobs number. The weak employment number pushed rate-hike estimates further out, and Financials had been performing well due to increased hawkishness from the Fed prior to today.
Here are some of the posts that caught my eye. Hope you find something interesting.
Here are some of the posts that caught my eye. Hope you find something interesting.
I recently had the opportunity to visit the S&P 500 Pit after speaking at the Trading Show in Chicago.
Compare it to the pit only 8 years ago and you'll notice an interesting change … but it's not necessarily as it seems.
via YouTube.
Don't let the slow pace and lack of frenzy fool you … Volume now is higher than ever. And the change in the pit isn't a harbinger of death for futures trading; it's the signal of a new era.
According to the CME Group, public outcry has fallen to 1% of total volume.
As the playing field changes, so does the game.
Onwards!